APT41’s Dodgebox: Defense Evasion and Detection Strategies

While conducting threat hunting research, I came across a defense evasion behavior in APT41’s Dodgebox malware that I haven’t seen formally documented as its own technique in MITRE ATT&CK. This post walks through what I found, why it matters, and how to detect it.

The Technique

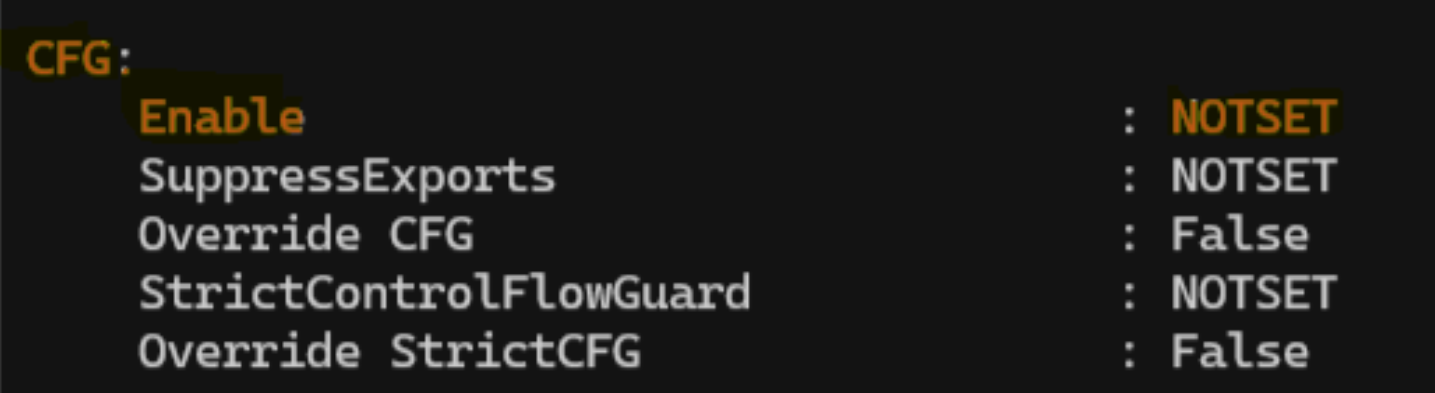
Dodgebox checks whether Control Flow Guard (CFG) is enabled on the system, and if it is, attempts to disable it.

CFG is a security feature built into modern Windows systems that restricts where an application can execute code. It’s designed to make it harder for attackers to exploit memory corruption vulnerabilities, like buffer overflows, to hijack control of a running program. When CFG is bypassed, an attacker significantly improves their odds of successful code execution and privilege escalation.

According to Zscaler’s ThreatLabz research on Dodgebox, the malware detects CFG status and, if active, modifies the LdrpHandleInvalidUserCallTarget function in ntdll.dll to disable it, effectively removing that security layer before proceeding.

Reference: Zscaler ThreatLabz, DodgeBox: A deep dive into the updated arsenal of APT41

Where This Sits in ATT&CK

This behavior maps cleanly to Defense Evasion, and specifically to the Disable or Modify Tools technique (currently T1685 in ATT&CK’s structure, previously catalogued under T1562.001). ATT&CK already documents APT41’s broader pattern of in-memory patching of security interfaces like AMSI and ETW inside ntdll.dll to evade detection without triggering obvious service termination events. The CFG check-and-disable behavior is consistent with that same pattern, but as of this writing, I haven’t found it documented as its own procedure example under any current sub-technique.

Worth noting separately: before disabling CFG, the malware first has to determine its status. That discovery step is arguably its own consideration, closer to System Information Discovery, and shouldn’t be conflated with the disable action itself.

Detection

    There are a few practical ways to check CFG status and hunt for this behavior.

    1. PowerShell – Per-Process Check
      • Get-ProcessMitigation lets you query the mitigation settings of a running process, including whether CFG is enabled:
        • Get-ProcessMitigation -System
      • If the result shows OFF, CFG is not enabled for that process. ON or NOTSET indicates CFG is enabled or set to the default configuration.
    2. PowerShell – Binary-level Check Across Systems
      • Get-PESecurity is a PowerShell module that examines Windows binaries to determine whether they were compiled with various security mitigations, including CFG. The relevant characteristic is stored as GUARD_CF with a value of 0x4000, which makes it possible to check for CFG support at the binary level rather than just the running-process level.
    3. EDR – Fleet-wide Check
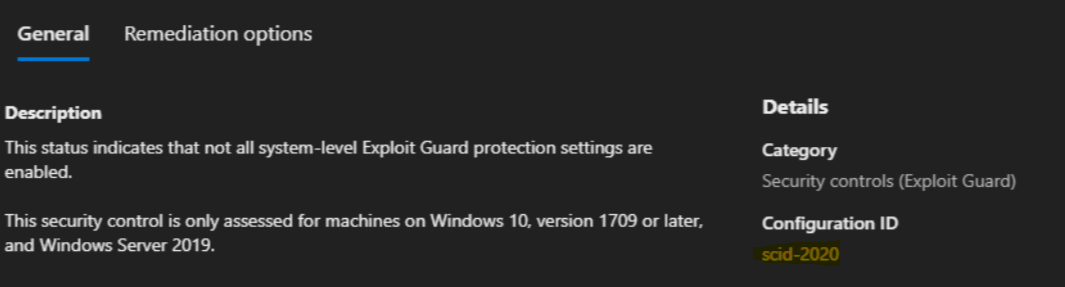
      • If you’re running Microsoft Defender for Endpoint, Advanced Hunting can assess CFG status across your environment:
        • DeviceTvmSecureConfigurationAssessment
        • | where ConfigurationID == "scid-2020"
        • | project DeviceName, OSPlatform, IsCompliant, Context
        • | join kind=leftouter (DeviceInfo | project DeviceName, PublicIP, IsAzureADJoined) on DeviceName
        • | summarize count() by IsCompliant, OSPlatform
      • This gives you a fleet-wide compliance view rather than a single host check, which is more useful for spotting systems where CFG has been disabled outside of normal configuration management.
    CFG Status
    SCID-2020

    If your organization has visibility into CFG status at scale, whether through EDR telemetry, binary analysis, or process mitigation checks, it’s worth adding to your detection coverage. This is a small, quiet step in an attack chain, but it’s also a step that’s currently easy to miss.

    References

    Tagged , , , , ,

    What I Learned Spending Weeks Researching Innovation Frameworks

    I went down a rabbit hole trying to find the “right” innovation framework. Turns out most of what I believed about innovation was completely wrong.

    I spent weeks studying MIT iTeams (for breakthrough tech exploration), Cascading Tree (for strategic alignment), GInI (for systematic enterprise innovation), and Scott Berkun’s The Myths of Innovation. Each framework works in different situations, but none is a silver bullet. And Bell Labs’ history taught me something crucial: pursuing an idea takes fourteen times as much effort as having it.

    The biggest lesson? I was waiting for the perfect framework before starting, doing exactly what Berkun warns against. Looking for some system that would remove all uncertainty before I began.

    Turns out innovation frameworks are useful tools when matched to the right situation and cultural context. But they can’t replace the courage to start imperfectly, the persistence to keep going, and the genuine curiosity to explore problems worth solving.

    [Read the full post on Substack โ†’]

    Includes a free info-graph with practical scenarios for each framework, diagnostic questions to assess organizational readiness, warning signs of when frameworks fail, and actionable first steps you can try this week.

    Tagged , , , , , , , , , ,

    Navigating AI Governance: Essential Frameworks & Principles (Part 2)

    Following up on my previous post about foundational AI concepts, I’m back with Part 2 of my AI learning journey!

    While Part 1 covered how AI works, this post tackles how we can use AI responsibly. A crucial side of AI goes beyond the technical aspects into: governance, ethics, risk management, and ensuring AI benefits everyone.

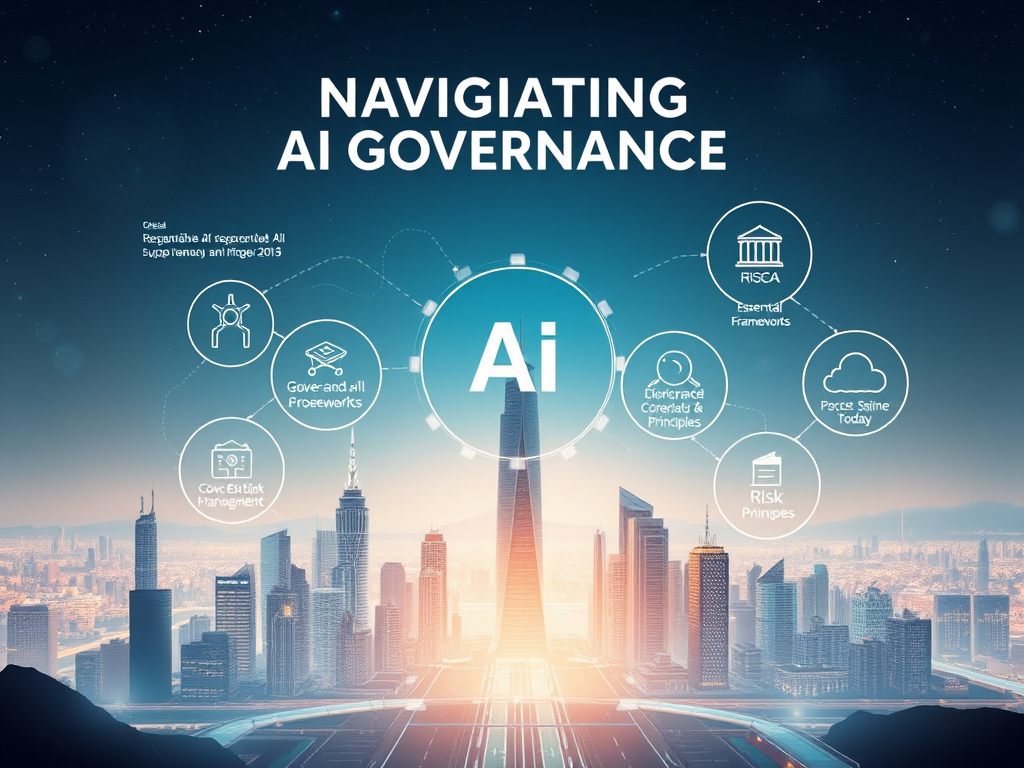
    AI Generated

    My AI Governance Notes

    I’m sharing my notes below to help others navigate AI governance. These break down complex frameworks into digestible insights.

    Note: These are personal notes, not comprehensive guides. Use them as a starting point for understanding responsible AI practices.

    Key takeaway: AI governance isn’t about slowing innovation. It’s about ensuring innovation benefits everyone.


    Frameworks, Standards, & More

    AI Lifecycle Phases

    1. Planning: Define goals, assumptions, stakeholders, governance, context
    2. Design & Development: Choose architecture, feature selection, bias testing
    3. Testing: Validate fairness, robustness, simulate deployment
    4. Deployment: Monitor initial performance, HITL (Human-in-the-Loop) review
    5. Monitoring: Drift detection, incident response, retraining

    Governance Principles

    1. Transparency – Openness on system operation
    2. Accountability – Clear responsibility chains
    3. Privacy & Security – Data protection built-in
    4. Fairness – Non-discrimination and bias management
    5. Human Oversight – Human control and intervention
    6. Reliability – Consistent and robust performance

    AI Explainability

    1. Explainability: Reasons for specific outputs
    2. Transparency: Openness on system operation
    3. Interpretability: Human-understandable decision logic

    Bias Types & Detection

    5 Key Bias Types:

    1. Data Bias: Biased training datasets
    2. Label Bias: Incorrect or biased labeling
    3. Automation Bias: Over-reliance on AI decisions
    4. Outcome Bias: Discriminatory results
    5. Confirmation Bias: Seeking confirming evidence

    Detection Methods:

    1. Statistical parity testing
    2. Equalized odds evaluation
    3. Demographic parity analysis
    4. Individual fairness measures

    Common AI Governance Roles

    1. Governance Team: Oversight and policy
    2. Developer: Design, build, train models
    3. Validator: Independent testing and validation
    4. Compliance Officer: Regulatory adherence
    5. Data Scientist: Data analysis and modeling
    6. Human Reviewer: Final decision authority

    Audit vs Test vs Monitor

    1. Audit: Post-deployment review (comprehensive assessment)
    2. Testing: Pre-deployment validation (before going live)
    3. Monitoring: Continuous ops review (ongoing surveillance)

    When Problems Arise

    1. Bias Detected: Audit first
    2. Model Performance Declines: Audit first
    3. Discrimination Complaints: Audit first

    Model Documentation Requirements

    1. Purpose: Why the model was built
    2. Data Used: Training data sources and characteristics
    3. Metrics: Performance and fairness measures
    4. Ethical Concerns: Identified risks and mitigations
    5. Deployment Context: Where and how it’s used

    Risk Management Key Components

    1. Model Inventory: Catalog of all AI systems
    2. Tiering: Risk-based classification system
    3. Controls: Safeguards and mitigations
    4. Incident Response Plan: Procedures for problems

    Human Oversight Levels

    Human-in-the-loop: Human makes final decisions. High-stakes decisions.
    Human-on-the-loop: Human monitors, can intervene. Medium-risk applications.
    Human-out-of-loop: Automated with oversight. Low-risk, high-volume.

    Trustworthy AI Characteristics

    1. Valid & reliable
    2. Safe, secure & resilient
    3. Accountable & transparent
    4. Explainable & interpretable
    5. Privacy-enhanced
    6. Fair with managed bias

    Disclaimer: AI tools were used to assist with research and drafting portions of this content and study guide.

    Tagged , , ,

    Making GARAK’s LLM Security Reports Actually Useful

    Lately, Iโ€™ve been running security assessments on various LLM applications using NVIDIAโ€™s GARAK tool. If you havenโ€™t come across it yet, GARAK is a powerful open-source scanner that checks LLMs for all kinds of vulnerabilities, everything from prompt injection to jailbreaks and data leakage.

    The tool itself is fantastic, but there was one thing driving me crazy: the reports.

    The Problem with JSONL Reports

    GARAK outputs all its test results as JSONL files (JSON Lines), which are basically long text files with one JSON object per line. Great for machines, terrible for humans trying to make sense of test results.

    I’d end up with these massive files full of valuable security data, but:

    • Couldn’t easily filter by vulnerability type
    • Had no way to sort or prioritize issues
    • Couldn’t quickly see patterns or success rates
    • Struggled to share the results with non-technical team members

    Anyone who’s tried opening a raw JSONL file and making sense of it knows the pain I’m talking about.

    The Solution: JSONL to Excel Converter

    After wrestling with this problem, I finally decided to build a solution. I created a simple Python script that takes GARAK’s JSONL reports and transforms them into nicely organized Excel workbooks.

    The tool

    1. Takes any JSONL file (not just GARAK reports) and converts it to Excel
    2. Creates multiple sheets for different views of the data
    3. Adds proper formatting, column sizing, and filters
    4. Generates summary sheets showing test distributions and success rates
    5. Makes it easy to identify and prioritize security issues

    Here’s what the output looks like for a typical GARAK report:

    • Summary sheet: Shows key fields like vulnerability type, status, and probe class
    • All Data sheet: Contains every single field from the original report
    • Status Analysis: Breaks down success/failure rates across all tests
    • Probe Success Rates: Shows which vulnerability types were most successful

    Why This Matters

    If you’re doing any kind of LLM security testing, quickly making sense of your test results is key. This simple conversion tool has saved me hours and helped me focus on real vulnerabilities instead of wrangling with report formatting.

    The best part is, the code is super simple; just a few lines of Python using pandas and xlsxwriter. I’ve put it up on GitHub for anyone to use.

    Wrapping Up

    Sometimes the simplest tools make the biggest difference. I built this converter to scratch my own itch, and it’s been surprisingly effective at saving time and effort.

    If you’re doing LLM security testing with GARAK, I hope it helps make your workflow smoother too.

    GARAK – JSONL to Excel Converter

    Also, check out my second tool: GARAK Live Log Monitor with Highlights. It’s a bash script that lets you watch GARAK logs in real-time, automatically highlights key events, and saves a colorized log for later review or sharing.

    Would love to hear your feedback!

    Tagged , , , , , , , , , , , ,
    Advertisements