In the fast-growing world of artificial intelligence (AI), Ollamais becoming a popular tool for people who want to run powerful AI language models on their own computers. Instead of relying on cloud servers, Ollama lets you run AI models locally, meaning you have more privacy and control over your data. This guide will show you how to install and set up Ollama on Kali Linux so you can experiment with AI models right from your device.
What Is Ollama?
Ollamais a software framework that makes it easy to download, run, and manage large language models (LLMs) like LLaMA and other similar models on your computer. It’s designed for privacy and efficiency, so your data doesn’t leave your device. Ollama is getting more popular with developers and researchers who need to test AI models in a secure, private environment without sending data over the internet.
Why Use Ollama?
Ollama is gaining popularity for several reasons:
Privacy: Running models locally means your data stays on your device, which is crucial for people handling sensitive information.
Performance: Ollama is optimized to run on CPUs, so you don’t need a high-end graphics card (GPU) to use it.
Ease of Use: With simple commands, you can easily download and manage different AI models, making it accessible for beginners and advanced users alike.
Why Install Ollama on Kali Linux?
Kali Linuxis a popular choice for cybersecurity professionals, ethical hackers, and digital forensics experts. It’s packed with tools for security testing, network analysis, and digital investigations. Adding Ollama to Kali Linux can be a big advantage for these users, letting them run advanced AI language models right on their own computer. This setup can help with tasks like analyzing threats, automating reports, and processing natural language data, such as logs and alerts.
By using Ollama on Kali Linux, professionals can:
Make Documentation Faster: AI models can help write reports, summaries, and other documents, saving time and improving consistency.
Automate Security Analysis: Combining Ollama with Kali’s security tools allows users to build scripts that look for trends, scan reports, and even identify potential threats.
Before You Begin Install
To get started with Ollama on Kali Linux, make sure you have:
Kali Linux version 2021.4 or later.
Enough RAM (at least 16GB is recommended for better performance).
sudo access on your system
Note: Ollama was initially built for macOS, so the setup on Linux may have some limitations. Be sure to check Ollama’s GitHub page for the latest updates.
Steps to Install Ollama on Kali Linux
Step 1: Update Your System
First, update your system to make sure all packages are up to date. Open a terminal and type:
sudo apt update && sudo apt upgrade -y
Install Ollama:
The official Ollama installation for Ubuntu or Debian-based systems is much simpler and usually involves running a curl command to download and execute an installation script:
curl -fsSL https://ollama.com/install.sh | sh
Verifying the Installation
ollama --version
You can also just enter ollama in the terminal and if its installed correctly you should see the following:
Installing and Running LLMs
The process for installing and running LLMs on Kali Linux is the same as on other Linux distributions:
To Install an LLM:
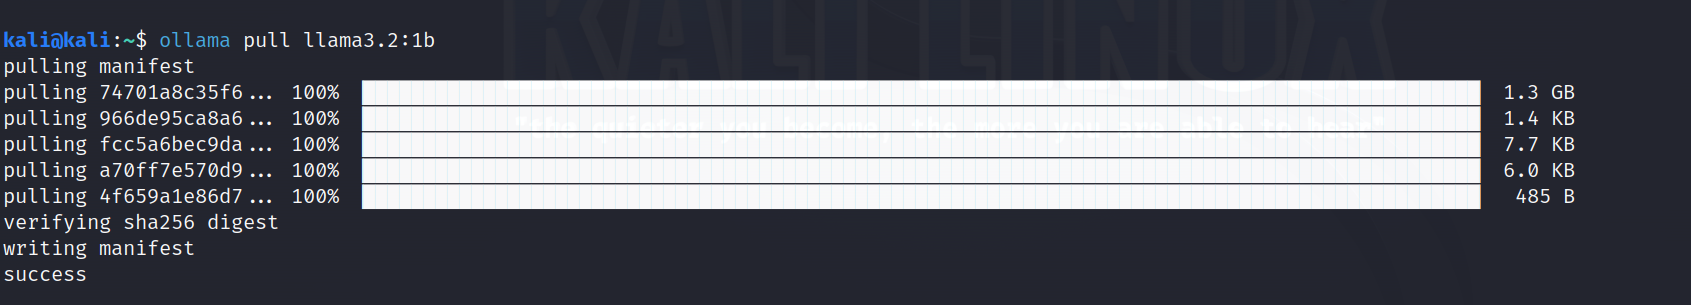
ollama pull <LLM_NAME>
In my case above, I installed llama3.2:1b model. You can see full library of models available on Ollama’s Github.
Start Prompt
After you’ve completed the previous steps, you can start Ollama with the specific model that you installed and send your prompts:
ollama run <LLM_NAME>
Conclusion
Ollama provides a great way to run large language models on your own machine, keeping data secure and private. With this guide, you can install and configure Ollama on Kali Linux and explore AI without relying on cloud-based services. Whether you’re a developer, AI enthusiast, or just curious about AI models, Ollama lets you experiment with language models directly from your device.
Stay tuned to the Ollama GitHub page for the latest features and updates. Happy experimenting with Ollama on Kali Linux!
Disclosure: Some of the content in this blog post may have been generated or inspired by large language models (LLMs). Effort has been made to ensure accuracy and clarity.
Artificial Intelligence (AI) is transforming the world around us, influencing industries from healthcare to finance. Recently, I had the opportunity to dive into an AI class, which provided a foundational overview of the core concepts driving this innovative field. Here, I’m excited to share my class notes.
AI Generated
The Birth of AI and Early Challenges
The term “Artificial Intelligence” (AI) first appeared in 1955, coined by American computer scientist John McCarthy. Just a year later, McCarthy played a pivotal role in organizing the Dartmouth Summer Research Project on Artificial Intelligence. This landmark conference brought together researchers from various disciplines and laid the groundwork for the development of related fields like data science, machine learning, and deep learning.
However, these early efforts in AI faced significant hurdles. The computers of the 1950s lacked the capacity to store complex instructions, hindering their ability to perform intricate tasks. Additionally, the exorbitant cost, leasing a computer back then could cost a staggering $200,000 per month!; severely limited access to this technology. Fortunately, advancements in computer technology over the following decades led to significant improvements in processing power, efficiency, and affordability, paving the way for a wider adoption of AI.
As AI systems become more complex and play larger roles in our lives, understanding how they make decisions is just as important as what those decisions are. To help make sense of this, three key concepts often come up: Explainable AI, Transparency, and Interpretability. The table below breaks down these terms in simple language to clarify what they mean and why they matter.
Term
What It Means in Simple Terms
What It Focuses On
When You See It
Example
Explainable AI (XAI)
AI that can tell you why/how it made a decision in a way you can understand
Giving clear reasons or justifications for specific AI outputs
Usually used when AI is complex and needs extra help explaining its decisions
A tool that explains why a loan was denied by highlighting key factors
Transparency
Being open about how the AI system works overall, its data, methods, and design. Transparency can answer the question of ‘what happened’ in the system
Sharing details about the AI’s structure and training process, but not explaining individual decisions
When you want to understand the general workings of the AI, not specific outcomes
Publishing the training data sources and model type publicly
Interpretability
How easy it is for a person to see and follow how the AI made a decision
The simplicity and clarity of the model’s decision-making process itself
Often refers to models that are simple enough to understand directly
A decision tree that shows step-by-step how it classified an input
Artificial Intelligence is a branch of computer science that deals with the creation of intelligent agents, which are systems that can reason, learn, and act autonomously.
Types of AI: Weak & Strong
When people talk about AI, they usually mean one of two kinds.
Weak AI, sometimes called Narrow AI, is designed to do just one thing well. Think of a GPS app like Google Maps that finds the best route for you or voice assistants like Siri and Alexa that understand simple commands. These systems are really good at their specific tasks but can’t do anything outside of them.
Strong AI, also known as Artificial General Intelligence or AGI, is different. This type would be able to learn and think across many different areas, kind of like a human. It would understand new situations and make decisions on its own, not just follow pre-set instructions. We don’t have strong AI yet, but it’s what many researchers are aiming for, something like the sci-fi idea of a truly intelligent robot or assistant that can help with anything you ask.
AI Breakdown
Artificial Intelligence
Machine Learning
Deep Learning: Deep Learning is a type of machine learning that uses artificial neural networks, inspired by the structure of the human brain. These networks can learn complex patterns from large amounts of data and achieve high accuracy.
Deep Neural Networks (DNNs)
Inspired by the human brain, they learn from data (like a baby learning a language) to recognize patterns and make predictions.
Need lots of data. The more data they see, the better they perform.
Highly accurate. Great for tasks like image recognition and speech recognition.
Neural Network Layers/Architectures
The different ways that DNNs can be constructed
Finding the right Layer/Architecture combination is a creative and challenging process.
Generative Adversarial Networks (GANs)
GANs are a type of deep learning system using two neural networks: a generator and a discriminator.
Imagine two art students competing. The generator keeps creating new art pieces, while the discriminator tries to identify if a piece is real or a forgery.
Through this adversarial training, both networks improve. The generator creates more realistic forgeries, and the discriminator gets better at spotting them.
Have the potential to be used in defensive & offensive cybersecurity.
Diffusion models are a recent advancement in generative AI specifically focused on creating high-quality, realistic images. They work by learning to remove noise from random noise, essentially reversing a noise addition process.
Analogy for understanding DNNs, GANs, & Diffusion models:
Think of DNNs as the general tools in a workshop. They provide the foundational capabilities for various tasks.
GANs are like specialized sculpting tools. They excel at creating new and interesting shapes (images) but might require more effort to refine the final product.
Diffusion models are like high-precision restoration tools. They meticulously remove noise and imperfections to create a clear and detailed image, but the process might take longer.
*RL, NLP, CV don’t always require Deep Learning to function.
But when Deep Learning is used, the power of Deep Neural Networks is applied; which improves the accuracy but require more data and computing power.
When Deep Learning is applied, the word Deep is appended in the front (i.e., Deep Computer Vision)
Adding DNNs isn’t a silver bullet to solving all use cases.
Details
Machine Learning
Machine Learning is a sub-field of AI that focuses on teaching computers to make predictions based on data.
There are three key aspects to designing a Machine Learning solution:
Objectives: What do you want the program to achieve? (e.g., spam detection, weather forecasting)
Data: The information the program will learn from. This data can be labeled (supervised learning) or unlabeled (unsupervised learning).
Algorithms: The method the program uses to learn from the data.
Data Types:
Structured Data:
This type of data is organized and follows a predefined format, like a spreadsheet with clear headings and rows/columns. It’s easily searchable and analyzed by computers.
Unstructured Data:
This data doesn’t have a fixed format and can be messy or complex. Examples include emails, social media posts, images, and videos.
While it requires additional processing, unstructured data can be incredibly valuable.
Humans primarily communicate using unstructured data, like natural language.
Unstructured data is vast and growing rapidly, exceeding the amount of structured data in the world.
AI Features
Before teaching a machine learning model, it’s important to pay attention to the data it learns from the features. How you choose, prepare, and check these features can make a big difference in how well the model works and how fair its decisions are. Here’s a simple breakdown of some key steps involving features and how they can help reduce bias.
Term
Simple Explanation
What It Focuses On
When in ML Pipeline
Relation to Bias Mitigation
Example / Note
Feature Validation
Ensuring features are accurate and consistent
Data quality checks
Early and ongoing data processing
Important for data quality; indirect impact on bias
Checking for missing or incorrect values
Feature Selection
Choosing which data inputs to use in the model
Picking relevant, useful, and fair features
Before or during model training
Helps reduce bias by excluding problematic features
Removing sensitive features like race or gender
Feature Transformation
Changing features into suitable formats or scales
Data preparation like normalization or encoding
Before or during training
No direct bias mitigation; just data formatting
Scaling age values to a 0–1 range
Feature Engineering
Creating or modifying features to improve model
Combining selection, transformation, creation
During feature preparation
Can reduce or introduce bias depending on design
Creating “income-to-debt” ratio feature
Feature Importance
Measuring which features impact model predictions most
Understanding feature influence after training
After training, for interpretation
Does not fix bias; just shows what matters most
Income strongly influences loan approval
Before teaching a machine learning model, it’s important to pay attention to the data it learns from: the features. How you choose, prepare, and check these features can make a big difference in how well the model works and how fair its decisions are. Here’s a simple breakdown of some key steps involving features and how they can help reduce bias.
Why Data is the Most Important Factor for Fairness in AI?
The biggest factor in making AI fair is the data it’s trained on. If the training data doesn’t include enough variety (especially from different groups of people or situations), the AI will likely pick up and even amplify those biases. No matter how advanced the model, how carefully the data is labeled, or how accurate the final predictions are, none of that can fix problems caused by limited or unrepresentative training data.
Think of it like this: AI learns patterns from the data it sees. If that data doesn’t show the full diversity of the real world, the AI will have blind spots and make biased decisions. Other factors can help improve a model, but they can’t make up for training data that doesn’t reflect the real-world variety it needs to understand.
Machine Learning Types
Supervised Learning is like being taught in school. The data you train the model on has labels or pre-defined categories. The model learns the relationship between these labels and the data to make future predictions.
Example: Classifying emails as spam or important.
Unsupervised Learning is more like exploring on your own. The data you provide has no labels. The model finds hidden patterns or groups within the data.
Example: Grouping customers based on their shopping habits.
Deterministic AI vs. Non-Deterministic AI
Aspect
Deterministic AI
Non-Deterministic AI
Output
Always the same for the same input
Can vary for the same input
Decision-making
Follows fixed, predefined rules or algorithms
Involves randomness, probabilities, or learning
Examples
Rule-based systems (e.g., Chess engines, SPSS for statistical analysis)
Unlikely, as outputs are strictly defined by rules and logic
More likely due to probabilistic nature, especially in language models (e.g., ChatGPT)
Strengths
Reliable, consistent, easier to validate
Flexible, adaptable, handles complex and dynamic environments
Weaknesses
Limited by rigid decision-making and lack of flexibility
Can be inconsistent, prone to hallucinations, harder to explain
Common Machine Learning Techniques
Regression: Used for predicting continuous values, like house prices or temperature.
Real Life Example:Uber uses regression to create a dynamic pricing model. This model considers factors like time of day, demand, and location to predict the optimal price for a ride. This balances customer retention (not setting prices too high) with price maximization (earning as much revenue as possible).
Classification: Sorting things into categories, like spam detection or identifying fraudulent credit card activity.
Real Life Example:American Express uses classification algorithms to identify potentially fraudulent activities on their credit cards. The algorithm is trained on historical data of fraudulent and legitimate transactions. It analyzes factors like purchase location, amount, and spending habits to flag suspicious activity in real-time.
Clustering: Finding natural groups within unlabeled data, like grouping customers with similar shopping habits.
Real Life Example: Spotify uses clustering for collaborative and content-based filtering to personalize user experience. Collaborative filtering groups users with similar listening habits and recommends music enjoyed by similar users. Content-based filtering clusters songs based on audio features and recommends songs similar to what a user already enjoys.
Association Rule Learning: Discovering hidden relationships between things in unlabeled data, like recommending movies based on what other viewers with similar tastes watched.
Real Life Example:Bali Tourism Board uses association rule learning to determine which attraction combinations tourists visit most often and when. By analyzing tourist data, they can uncover patterns like “tourists visiting temples often visit beaches afterward.” This allows for better optimization of infrastructure, staffing, and accommodation availability at different attractions throughout the day.
Reinforcement Learning (RL)
Where a computer is given a problem. It is rewarded (+1) for finding a solution or punished (-1) for not finding a solution.
Unlike supervised learning, the computer (agent) is NOT given instructions on how to complete the task. Instead, it learns through trial and error to learn which actions are good and which are bad.
Similar to how humans learn.
How babies learn how to walk. When a baby falls over, it feels pain and learns not to repeat the same action again.
Therefore, reinforcement learning is the closest technology we have got in terms of true artificial intelligence.
Reinforcement learning algorithms are better tools to find solutions free from bias and discrimination.
It is adaptable and doesn’t require retraining.
Can learn live online (Spotify/Ecommerce Recommendation)
Difference between Reinforcement Learning and Unsupervised Learning:
Reinforcement learning is about learning through rewards and punishments to make decisions, while unsupervised learning is about finding hidden patterns or structures in data without any rewards or feedback.
Analogy:
Imagine you’re observing a dog. In reinforcement learning, you are training the dog by giving it a treat when it sits and saying “no” when it misbehaves. The dog learns which actions lead to rewards.
In unsupervised learning, you are not interacting with the dog at all. Instead, you’re just watching a group of dogs and trying to figure out patterns on your own, like which ones behave similarly or belong to the same breed.
Natural Language Processing (NLP)
Field of AI concerned with the interactions between computers and human natural languages.
Focuses on programming computers to process and analyze large amounts of natural language data.
Most complex part of NLP is extracting accurate context and meaning given a natural language.
Involves two main tasks (some applications may require both, while others may only need one):
Natural Language Understanding (NLU):
Maps the given input from natural language into a formal representation and analyzes it.
Example: If the input is audio, then speech recognition is applied first. This converts the audio to text, and then the hard part of interpreting the meaning of the text is performed.
Natural Language Generation (NLG):
Process of producing meaningful phrases and sentences in the form of natural language from some internal representation.
NLG is generally considered much easier than NLU.
It can also convert generated text into speech (e.g., Siri and Alexa).
Generative AI: a broad description of AI that generates data, such as text, images, audio, video, code using some form of AI.
Natural Language Processing (NLP) Use Cases
ChatBots
Analyze survey results
Document review for compliance, legality, typo, etc.
Focus on developing algorithms capable of understanding, generating, and interacting with human languages.
Their key advantage is that they excel at understanding context over long stretches of unstructured text data.
How do LLMs work?
LLMs are built on layers of neural networks, specifically designed to mimic how humans process and generate language.
They can’t think like humans, but they leverage human language patterns to simulate human-like text generation.
One way they do this is by predicting the next most likely word in a sequence.
How are LLMs trained?
Pre-Training:
LLMs are exposed to massive amounts of text data from various sources like wikis, blogs, social media, news articles, and books.
During this process, they learn and practice predicting the next word in sentences.
Fine-Tuning:
The model is then trained on datasets specific to a particular task, allowing it to apply its capabilities to solve specific business challenges.
The versatility of LLMs lies in their ability to be customized for a wide range of tasks, from general to highly specific.
Examples of Large Language Models
Model
Advantages
Category
GPT-1
First publicly available GPT (Generative Pre-Trained) model
Text
GPT-2
Significantly increased performance over GPT-1
Text
GPT-3
State-of-the-art performance on many NLP tasks
Text
Jurassic-1 Jumbo
Large and powerful LLM, excels in code generation
Text
GPT-j
Focused on translation tasks, excels in multilingual translation
Text
DALL-E 2
Generates high-quality and creative images
Image
Midjourney
Generates high-quality and creative images. It utilizes Discord as its interface for generating AI art.
Image
Stable Diffusion
Generates high-quality and creative images
Image
BERT
Excellent for text understanding and question answering
Text
Bard
Large language model from Google AI, similar to LaMDA
Text
LaMDA
Focuses on dialogue applications, can be informative and comprehensive
Text
Prompt Engineering: crafting ideal inputs in order to get the most out of large models.
Token: A unit easily understood by a language model. One word can be made up of multiple tokens. Example:
Words
Tokens
Everyone
[Every, one]
I’d love
[I, ‘d, love]
Tokenization: The mechanism by which a model splits its inputs into tokens. A given method can greatly affect a model’s output. Large Language Models take an input and produces a token as output. The model uses its training from vast text sources to predict what words likely follow the input tokens.
Improves the accuracy and reliability of the traditional large language models (LLMs) by incorporating information from external sources.
It is ideal for situations where the underlying data changes frequently and the system needs to generate tailored outputs based on the latest information.
Traditional LLMs generate text based solely on the input they receive and their learned parameters. They do not directly retrieve external information during the generation process.
External Knowledge Base: RAG integrates the LLM with an external source of reliable information, like a specialized database or knowledge base. This allows the LLM to access and reference factual information when responding to prompts or questions.
In a way, attempts to combine LLM capabilities with traditional Search Engine (i.e. if ChatGPT & Google had a child)
Improve Response Generation: When you ask a question, RAG first uses the LLM to understand your intent. Then, it retrieves relevant information from the external knowledge base and feeds it back into the LLM. Finally, the LLM uses this combined knowledge to generate a response that is both comprehensive and accurate.
Multimodal Generative AI: Involves multiple data types (text, images, audio).
Expert System: Rule-based systems with static logic; less flexible for dynamic, frequently changing information.
RAGs Help LLMs by:
Be more factually accurate
Stay up-to-date with current information
Provide users with a better sense of where their answers are coming from
Challenges:
LLMs: LLMs generate text based on the patterns and associations learned from vast amounts of text data. Therefore, the main challenge with LLMs lies in their potential to generate incorrect or misleading information, especially in scenarios where the training data is biased or incomplete.
RAGs: While RAG addresses some of these issues by leveraging external knowledge, it introduces challenges related to the retrieval process itself(ethical, violations of terms), such as ensuring the retrieved information is accurate, up-to-date, and relevant to the context of the generated text.
Computer Vision (CV)
There are 2 types of Computer Vision algorithms:
Classical CV: excels at specific tasks like object detection (identifying cats or dogs) with high speed and accuracy.
Deep Learning CV: used when classical methods don’t provide enough power for complex tasks. Deep Learning algorithms can learn intricate patterns from vast amounts of data, enabling them to tackle more challenging computer vision problems. Examples:
Facial Recognition: Deep learning algorithms can analyze facial features with high accuracy, enabling applications like unlocking smartphones with your face, identifying individuals in security footage, or even personalizing advertising based on demographics.
Self-Driving Cars: Deep learning is crucial for self-driving cars to navigate complex environments. These algorithms can process visual data from cameras in real-time, allowing the car to identify objects like pedestrians, vehicles, and traffic signals, and make decisions accordingly.
Medical Image Analysis: Deep learning can analyze medical images (X-rays, MRIs) with impressive accuracy, assisting doctors in tasks like cancer detection, anomaly identification, and treatment planning.
Object Detection and Tracking: While classical CV can handle basic object detection, deep learning excels at identifying and tracking a wider range of objects in real-time. This is valuable for applications like surveillance systems, sports analytics, and autonomous robots.
Image Segmentation: Deep learning can segment images into specific regions, allowing for a more granular understanding of the content. This is useful in applications like autonomous farming (identifying crops vs weeds), self-checkout systems (differentiating between items), and augmented reality (overlaying virtual objects on real-world scenes).
Handwriting Recognition (HWR)
Imagine you have a letter written by your friend, but instead of typing, they used pen and paper. Handwriting Recognition (HWR) is like a magic decoder for that letter. So, HWR takes your friend’s written letter (handwriting) and turns it into something a computer can understand (recognition). It basically translates the scribbles into text you can read on a screen!
AI architecture is basically how an AI system is built—how it learns, thinks, and makes decisions. Think of it like the blueprint or design plan of a machine. Different architectures use different methods to understand and work with data.
Core Types of AI Architectures
Category
Examples
Description
Symbolic AI
Expert Systems, Logic Rules
Uses predefined logic and rules, no learning. Good for explainability.
Statistical / Classical ML
Decision Trees, Random Forests, SVM
Learns from data using traditional algorithms. Structured, tabular data.
Neural Networks (Deep Learning)
CNNs, RNNs, Transformers, LLMs
Learns patterns from unstructured data (images, text). Highly scalable.
Generative Models
GANs, VAEs, Diffusion Models, LLMs
Learns to generate new data similar to what it was trained on.
Hybrid / Neuro-symbolic
Symbolic + Neural (e.g., Logic + LLM)
Combines rule-based reasoning with learning-based perception.
Uses search to retrieve facts, then generates answers. Reduces hallucinations.
General-Purpose AI (GPAI)
Not yet fully realized (AGI)
Hypothetical AI that can perform any cognitive task. LLMs are precursors.
What About Auxiliary Tools?
These are tools and software that help you build, run, and manage AI systems. They’re not AI themselves but are essential to making AI work in the real world. Some examples:
Tool Type
Examples
Purpose
Frameworks
TensorFlow, PyTorch, Scikit-learn
Build and train models
Data Processing
Pandas, NumPy, Apache Spark
Prepare data for AI
Model Ops / Deployment
MLflow, Kubernetes, SageMaker
Manage lifecycle of models
Monitoring
WhyLabs, Evidently AI, Arize
Track model performance
Explainability
SHAP, LIME
Make AI decisions interpretable
Data Labeling
Labelbox, Prodigy
Annotate training data
Embedding Stores / Vector DBs
Pinecone, FAISS, Weaviate
Power retrieval in RAG systems
Prompt Engineering / LLM Toolkits
LangChain, LlamaIndex
Build apps on top of LLMs
This is just the tip of the iceberg when it comes to AI. There’s a whole world out there, and I’m just getting started exploring it myself. I hope to share future notes on any additional learning. Feel free to reach out if you have any questions or comments.
AI Architecture = the structural design of how an AI system thinks and learns.
Auxiliary Tools = supporting tech used to build, deploy, interpret, and scale AI systems.
AI Stack Layers (Simplified)
Platforms and Applications (Top Layer) This is where people interact with AI. It includes things like:
Cloud services (AWS SageMaker, Google AI Platform)
Apps powered by AI (chatbots, recommendation systems)
APIs that let developers plug AI into their own software
Think of this as the user-friendly interface and infrastructure that make AI accessible and useful. It’s above the actual AI models and tools, it wraps everything so users can easily use the AI.
Model Types (Middle Layer) These are the actual AI architectures: the brains behind the scenes. Examples:
Neural networks (including transformers)
Decision trees and random forests
Expert systems (rule-based AI)
Generative models
This layer does the learning and decision-making. It takes data and figures out patterns or generates new content.
Auxiliary Tools (Supporting Layer) These help build, train, deploy, monitor, and explain the AI models. Examples:
Frameworks like PyTorch or TensorFlow
Data processing libraries
Monitoring and explainability tools
Vector databases for retrieval
What Does It Mean for AI to Be Robust?
A robust AI system holds up well when things get messy in the real world. It keeps doing its job correctly even when faced with noisy data, weird inputs, or deliberate attempts to throw it off course.
Example: Think of a robust self-driving car that stays safe on the road despite sudden downpours, partially covered street signs, or unexpected construction work. It handles these curveballs without missing a beat.
This isn’t the same as:
Reliable: A reliable system is consistent but only under normal conditions. It’s like that friend who’s always on time when everything goes according to plan, but falls apart when complications arise. Example: A reliable car performs perfectly on a clear day with perfect road markings, but might get confused during a heavy fog or when facing unusual traffic patterns.
Resilient: A resilient system bounces back after problems but doesn’t necessarily stay steady during the rough patch. Example: A resilient car might temporarily shut down certain functions when it detects a problem, then restore normal operation once conditions improve. It recovers well, but doesn’t necessarily power through difficulties.
Disclaimer: Various AI tools were used to assist with research and content writing for this blog. While every effort has been made to verify the accuracy of the information presented, some details may evolve as AI technology advances. Readers are encouraged to consult additional sources for the most up-to-date information.
Be the person that can communicate in digital and analog.
I recently completed an executive leadership course, where I learned the importance of engineers becoming familiar with common business and executive taxonomies to become more effective in their roles. Here are my takeaways and additional research on this topic.
As organizations grow in complexity, engineers who understand and utilize business taxonomies can bridge the gap between technical details and executive-level decision-making, positioning themselves as effective communicators and strategic assets.
Business taxonomies play a crucial role in bridging this gap. These structured systems of classification provide a common language for organizing and categorizing information, enabling engineers to convey complex technical concepts in a clear and understandable manner.
Don’t make the business person an IT person. You, as an IT person have to become the business person.
Engineers who master the use of business taxonomies position themselves as valuable assets within their organizations. Their ability to translate technical details into actionable business insights empowers them to influence strategic decisions, drive innovation, and contribute to the overall success of the company.
By effectively utilizing taxonomies, engineers can:
Understand the business perspective
Communicate their viewpoint in a way that executives can easily understand
Make better decisions together
Achieve better outcomes
Common Elements of Executive Communication Taxonomies
Executive communication taxonomies provide a structured framework of terms and concepts that executives can use to clearly and effectively convey complex ideas and make well-informed decisions during meetings and discussions.
Some common elements of executive communication taxonomies include:
Term
Description
Explain to a 10 Yr. Old
Budget Allocation:
The distribution of financial resources to different areas of the business.
Think of budget allocation like planning how to spend your allowance. If you get $10, you might decide to spend $5 on toys, $3 on snacks, and $2 on saving for something special. It’s like making a money plan for different things you want.
Competitive Landscape:
Analysis of other companies operating in the same industry and how they may impact the organization.
Imagine you have a lemonade stand, and there are other kids with lemonade stands too. Looking at the competitive landscape is like checking what they are doing – maybe they have a cool sign or a better recipe. It’s about understanding your lemonade business compared to others.
Key performance indicators (KPIs):
The metrics that will be used to measure the organization’s progress towards its goals.
KPIs are like the report card for your lemonade stand. How much money did you make? How many cups did you sell? It’s the important stuff that shows if your lemonade stand is doing well.
Market Share:
The percentage of the total market that a company or product controls.
If there are 10 lemonade stands in your neighborhood, and you sell 5 cups, your market share is 50%. It’s like saying, “I sold half of all the lemonade in our neighborhood.”
Milestones:
Significant points or events in a project or timeline.
Milestones are like checkpoints in a race. If your lemonade stand is a race, hitting a milestone could be reaching a certain number of cups sold. It’s a way to know you’re on the right track.
Quarterly or Annual Reports:
Summaries of a company’s financial performance and strategic updates.
Imagine you’re running a lemonade stand. At the end of each day, you count your earnings and subtract the cost of the ingredients. That’s like a quarterly report. At the end of the summer, you add up all your earnings and expenses. That’s like an annual report.
Return on Investment (ROI):
A measure of the profitability of an investment, often expressed as a percentage.
Let’s say you buy a new bike for $100. You use it to deliver newspapers and earn $50 a week. After two weeks, you’ve made back your $100 investment. That means your ROI is 100%. The higher the ROI, the better the investment.
Resources:
The people, money, and other assets that the organization needs to achieve its goals.
Imagine you’re building a treehouse. You’ll need wood, nails, a hammer, and a friend to help you. These are your resources. Businesses need resources like people, money, and equipment to achieve their goals.
Stakeholder Engagement:
Strategies for communicating and interacting with various stakeholders, including employees, customers, investors, and the community.
Let’s say you’re starting a new club at school. You need to talk to your teachers, classmates, and parents to get their support. That’s stakeholder engagement. Businesses need to communicate with their employees, customers, investors, and the community to succeed.
Strategic Initiatives
Major projects or programs that align with the organization’s overall strategy.
Imagine you’re planning a big family trip. You need to decide where to go, how to get there, and what to do once you’re there. These are your strategic initiatives. Businesses need major projects or programs to achieve their overall strategy.
Strategic Objectives:
High-level goals that the organization aims to achieve over a specific period.
Let’s say you want to get good grades in school. You might set objectives like studying for an hour each night and doing all your homework. Strategic objectives are high-level goals that an organization aims to achieve over a specific period.
SWOT Analysis:
An evaluation of a company’s Strengths, Weaknesses, Opportunities, and Threats to inform strategic planning.
Imagine you’re playing a game of basketball. You need to know your strengths (like being tall and fast) and weaknesses (like not being a good shooter). You also need to know the opportunities (like playing on a good team) and threats (like playing against a tough opponent). That’s a SWOT analysis. Businesses use SWOT analysis to inform their strategic planning.
Tactics:
The specific actions that will be taken to implement the strategy.
Imagine you’re trying to save up for a new video game. You might save your allowance, do chores for extra money, or sell old toys. These are your tactics. Businesses need specific actions to implement their strategy.
Value Proposition:
The unique value that a product or service offers to customers.
Let’s say you’re selling homemade cookies. You need to convince people that your cookies are better than the ones at the store. That’s your value proposition. Businesses need to explain why their product or service is unique and valuable to customers.
Vision and mission:
The organization’s long-term goals and objectives.
Imagine you want to be a doctor when you grow up. That’s your vision. Your mission is to study hard and get into medical school. An organization’s vision is its long-term goals, and its mission is how it plans to achieve those goals.
Common Elements of Executive Communication Taxonomies
Risk Management Taxonomies
A taxonomy of the most common risk-related terms and concepts is essential for dealing with potential problems and unexpected situations:
Term
Description
Explain to a 10 Yr. Old
Contingency Plan:
A set of predetermined actions to be taken when specific risks materialize.
Imagine you have a backup plan for your birthday party in case it rains. A contingency plan is like that but for grown-up stuff. It’s a set of plans ready to use if something unexpected or risky happens.
Compliance Risks:
Risks associated with failing to comply with relevant laws, regulations, and industry standards.
Think of rules in a game. If you don’t follow them, you might get in trouble or lose. In real life, not following laws or important rules can be a big problem, and that’s what compliance risks are about.
Crisis Management:
Protocols and strategies for responding to and recovering from a crisis or unexpected event.
Remember when the power went out, and your parents had flashlights and candles ready? Crisis management is like having a plan and tools for when something really bad happens, so you can fix it and get back to normal.
Cybersecurity Risks:
Potential threats to the security and integrity of digital assets and information.
Just like you lock your diary to keep it private, companies need to protect their computer stuff from bad people. Cybersecurity risks are like making sure the computer doesn’t get ‘sick’ or that nobody steals important information.
Enterprise Risk Management (ERM):
An integrated and holistic approach to managing all types of risks across an organization.
Think of a big puzzle with many pieces. ERM is like looking at the whole puzzle, not just one piece. It’s about making sure everything in a company works together and is safe from risks.
Financial Risks:
Risks related to financial markets, currency fluctuations, and other economic factors.
Imagine your piggy bank getting lighter because the value of your coins changes. Financial risks are like that, but for grown-ups. It’s about being careful with money because things like prices and money values can change.
Insurance Coverage:
Evaluating and maintaining appropriate insurance policies to mitigate certain types of risks.
When you play a game, sometimes you have special cards that protect you. Insurance is like those cards for real life. It helps if something bad happens, like if your toy breaks or your house gets a little damaged.
Operational Risks:
Risks arising from internal processes, systems, people, or external events that could impact operations.
Think about a big robot working in a factory. If something goes wrong with the robot or the people working, it can stop making toys. Operational risks are like making sure everything works smoothly so the toys keep coming.
Reputational Risk:
The risk of damage to the organization’s reputation, brand, or image.
You know how your friends might not want to play if you break the rules? Reputational risk is like that for companies. If they do something wrong, people might not want to be friends with them (buy their stuff) anymore.
Risk Appetite:
The level of risk that an organization is willing to accept in pursuit of its objectives.
It’s like saying how much spicy food you can handle. Companies decide how much risk they’re okay with to reach their goals. Some like it a bit risky, and some like it safer.
Risk Assessment:
The process of evaluating potential risks, including their likelihood and potential impact on the organization.
Imagine making a list of all the things that could go wrong when you plan a big game. That’s a bit like risk assessment – thinking about what might happen and how bad it could be.
Risk Communication:
Effectively communicating risks to stakeholders, both internal and external.
If you found out the game rules changed, you’d tell your friends, right? Risk communication is like that but for grown-ups. It’s telling everyone involved about the possible problems and how to deal with them.
Risk Governance:
The framework, policies, and processes for managing and overseeing risk management activities.
Think of it like having a boss who makes sure everyone follows the rules. Risk governance is about having leaders who make sure the company is safe from risks and does things the right way.
Risk Mitigation:
Strategies and actions taken to reduce or eliminate the impact of identified risks.
Remember playing tag and having a safe zone? That’s a bit like risk mitigation – finding ways to make problems not so bad or stop them from happening.
Risk Register:
A comprehensive list of identified risks along with relevant details such as impact, likelihood, and mitigation strategies.
It’s like having a list of all the things that could go wrong in your game, along with how to stop them. A risk register is a grown-up list for companies, helping them be ready for possible problems.
Scenario Planning:
Anticipating and preparing for different potential future scenarios to enhance resilience.
Pretend you’re the captain of a spaceship. Scenario planning is like thinking about what might happen during your space journey and preparing for different things, like meeting aliens or fixing a broken spaceship.
Strategic Risks:
Risks associated with the execution of the organization’s strategy, including market changes and competition.
Imagine you’re the captain of a soccer team. Strategic risks are like thinking about how the other team plays and planning how to win. It’s about making sure the big plan works well.
Supply Chain Risks:
Potential disruptions or issues within the supply chain that could impact production or delivery.
Think about all the people who help make your pizza, from the cook to the delivery person. Supply chain risks are like making sure everyone does their job so you get your pizza on time and hot.
Risk Tolerance:
The acceptable level of variation relative to achieving business objectives.
It’s like saying how many mistakes you’re okay with when playing a game. Companies decide how much variation they can handle while still reaching their goals – how much risk is too much or just enough.
Finance and Budgeting Taxonomies To organize and manage financial information, businesses often use different sets of categories and structures called taxonomies and frameworks. These frameworks help executives make informed decisions and allocate resources effectively.
What would you add to this list? Share with me @azeemnow
Term
Description
Explain to a 10 Yr. Old
Capital Expenditures (CapEx) vs. Operational Expenditures (OpEx):
CapEx: Investments in long-term assets, such as equipment or facilities.
CapEx: Think of buying things that last a really long time, like a computer for your school or a playground for the park.
OpEx: Day-to-day operational expenses, including rent, utilities, and wages.
OpEx: This is like everyday spending, such as paying for electricity, water, or someone’s salary to help with daily tasks.
Cost Centers:
Administrative Costs: Encompasses general administrative expenses such as salaries, office supplies, and utilities.
Administrative Costs: Money used for things like paying your teacher, buying pencils, and keeping the lights on at school.
Production Costs: Includes all costs associated with manufacturing goods or delivering services.
Production Costs: Money spent on making things, like buying ingredients to bake cookies or materials to build a treehouse.
Depreciation and Amortization:
Depreciation and amortization are expenses that reflect the wear and tear of assets over time. Depreciation: is used for tangible assets, such as buildings and equipment.
Depreciation is like the cost of using something up. It’s the amount of value that something loses over time. For example, if you buy a bike for $100 and it depreciates by $10 a year, then after 5 years, the bike will only be worth $50.
Amortization: is used for intangible assets, such as patents and copyrights.
Amortization: is similar to depreciation, but it is used for intangible assets, which are things that you can’t touch. Examples of intangible assets include patents, copyrights, and trademarks. These assets also lose value over time, but they do so in a different way than tangible assets. For example, if you buy a patent for a new invention, the patent will only be worth something if it is still useful. If someone else comes up with a better invention, then your patent will lose value.
Expense Categories:
Fixed Expenses: Costs that remain constant regardless of production levels or sales, such as rent or salaries.
Fixed Expenses: Things you have to pay regularly, like rent for your house or your teacher’s salary.
Variable Expenses: Costs that vary proportionally with production or sales, such as raw materials or commissions.
Variable Expenses: These change depending on what you’re doing, like buying more ingredients when baking more cookies.
Geographic Segmentation:
Domestic vs. International: Separation of financials based on geographical location.
Domestic vs. International: This is like comparing your neighborhood (domestic) to places far away (international).
Regional Breakdowns: Analysis of performance in specific regions or countries.
Regional Breakdowns: Understanding how well things are going in specific parts of your neighborhood or faraway places.
Performance Metrics:
Key Performance Indicators (KPIs): Quantifiable measures of business performance.
Key Performance Indicators (KPIs): Like report cards, showing how well you’re doing in different subjects.
Return on Investment (ROI): Analysis of the profitability of an investment.
Return on Investment (ROI): Imagine you lend a friend your toy, and they give you some of their snacks in return. It’s like figuring out if your toy “investment” was a good idea.
Profit and Loss (P&L) Categories:
Cost of Goods Sold (COGS): Direct costs associated with producing goods or services.
Cost of Goods Sold (COGS): The money you spent on making or buying the cookies.
Gross Profit: Revenue minus COGS.
Gross Profit: How much money you made from selling cookies, minus the cost of making them.
Net Profit Before/After Tax: The final profit after all expenses, including taxes.
Net Profit Before/After Tax: The money you have left after paying for everything, including taxes (like a cookie tax).
Operating Expenses: All non-production expenses.
Operating Expenses: Other costs, like renting the space to sell your cookies.
Revenue: Total income generated by the business.
Revenue: How much money you made from selling all your cookies.
Project Budgets:
Project Revenue and Costs: Specific budgets for individual projects.
Project Revenue and Costs: Planning how much money you’ll make and spend when doing a special task, like organizing a school fair.
Revenue Streams:
Product Revenue: Income generated from the sale of goods or services.
Product Revenue: Money from selling things like lemonade or toys.
Service Revenue: Income generated from providing services.
Service Revenue: Money earned by doing helpful things for others, like babysitting or mowing lawns.
Tax Categories:
Income Tax: Amount set aside for income taxes.
Income Tax: Like a small part of the money you make that you give to a school fund.
Sales Tax: Collected on sales of goods and services.
Sales Tax: Extra money added to the price of things you buy, which goes to the government.
Time Periods:
Annual Budgets: Financial plans for a fiscal year.
Annual Budgets: Planning how you’ll spend your money for the entire school year.
Quarterly or Monthly Budgets: Short-term budgeting for more immediate planning.
Quarterly or Monthly Budgets: Planning how to spend your money for shorter periods, like a few months or weeks.
Finance and Budgeting Taxonomies
What would you add to this list? Tell me @azeemnow
Business Performance and Competition Taxonomies Various frameworks and classifications are commonly used to examine and evaluate crucial aspects of a company’s operations and competitive environment. These systems help businesses gain insights into their performance and identify areas for improvement. Some of the most widely used taxonomies in this domain include:
Financial Perspective: Imagine it’s like keeping track of how many cookies you have (money).
Customer Perspective: Customer satisfaction and relationship metrics.
Customer Perspective: Making sure your friends are happy with your cookies (satisfaction).
Internal Business Processes: Efficiency and effectiveness of internal operations.
Internal Business Processes: Figuring out the best way to bake cookies efficiently.
Learning and Growth Perspective: Employee development and innovation metrics.
Learning and Growth Perspective: Learning new cookie recipes and becoming better at baking.
Benchmarking:
Comparison: of the company’s performance against industry benchmarks or competitors.
Comparison: It’s like checking if your cookie recipe is as good as your friend’s recipe.
Competitor Analysis:
Market Positioning: Understanding where the company stands in comparison to competitors.
Market Positioning: Knowing if your cookie stand is in a good spot compared to others.
Strengths and Weaknesses: Identifying the competitive advantages and disadvantages.
Strengths and Weaknesses: Finding out what makes your cookies special and where you can improve.
Market Share: Assessing the percentage of the market controlled by the company.
Market Share: Seeing how many people buy your cookies compared to others.
Financial Ratios:
Efficiency Ratios: Assessing the company’s ability to meet short-term obligations.
Efficiency Ratios: Checking if you’re using your ingredients (resources) wisely.
Leverage Ratios: Examining the use of debt in the company’s capital structure.
Leverage Ratios: Figuring out if you borrowed too much sugar (debt).
Liquidity Ratios: Assessing the company’s ability to meet short-term obligations.
Liquidity Ratios: Making sure you have enough flour (money) for urgent cookie orders.
Profitability Ratios: Evaluating the company’s ability to generate profit.
Profitability Ratios: Checking if you’re making enough extra cookies to share.
Market Segmentation:
Division of the market into specific customer segments for targeted analysis.
Division: Grouping your customers based on who likes chocolate chip cookies, who likes oatmeal cookies, etc.
PESTLE Analysis:
Economic: Analysis of economic conditions and trends.
Economic: Checking if people have enough money to buy cookies.
Environmental: Evaluation of environmental and sustainability factors.
Environmental: Making sure your cookie ingredients are good for the environment.
Legal: Consideration of legal and regulatory aspects.
Legal: Following the rules for selling cookies.
Political: Evaluation of the impact of political factors on the business.
Political: Seeing if new rules from the cookie council will affect your business.
Social: Examination of social and cultural influences.
Social: Knowing what cookies are trendy or popular.
Technological: Assessment of technological factors affecting the industry.
Technological: Using new gadgets or tools to bake better cookies.
Porter’s Five Forces:
Bargaining Power of Buyers: The influence buyers have on prices and terms.
Bargaining Power of Buyers: Seeing if your friends can ask for discounts on your cookies.
Bargaining Power of Suppliers: The influence suppliers have on the cost of inputs.
Bargaining Power of Suppliers: Checking if your ingredient suppliers can change their prices.
Intensity of Competitive Rivalry: The level of competition within the industry.
Intensity of Competitive Rivalry: How many other kids are selling cookies in your neighborhood.
Threat of New Entrants: How easy it is for new competitors to enter the market.
Threat of New Entrants: If new kids start selling cookies, will it be hard for you to sell yours?
Threat of Substitute Products or Services: The availability of alternative products or services.
Threat of Substitute Products or Services: If your friends start making cupcakes instead of cookies.
Product Life Cycle:
Decline: Market saturation and decreasing demand.
Decline: People might get tired of your cookies, and fewer want them.
Growth: Period of rapid market acceptance.
Growth: Everyone suddenly loves your cookies, and you’re selling a lot.
Introduction: Launch and initial market entry.
Introduction: You just started selling your first batch of cookies.
Maturity: Stable market with slower growth.
Maturity: Your cookie business is steady, and people like your cookies.
SWOT Analysis:
Opportunities: External factors that could benefit the company.
Opportunities: Finding new ways to sell more cookies, like at a school event.
Strengths: Internal factors that give the company an advantage.
Strengths: Knowing you bake the tastiest cookies in the neighborhood.
Threats: External factors that could pose challenges to the company.
Threats: If it rains, fewer people might come to buy your cookies.
Weaknesses: Internal factors that may put the company at a disadvantage.
Weaknesses: Your cookie stand might be too small, and you can’t bake enough cookies at once.
Business Performance and Competition Taxonomies
What would you add to this list? Tell me @azeemnow
Startup and Business Investment Taxonomies
These taxonomies help business leaders sort, examine, and make decisions about investments in new companies or existing businesses based on various factors, strategies, and objectives. The specific taxonomy used may vary depending on the industry, company size, and investment objectives.
Term
Description
Explain to a 10 Yr. Old
Stage of Investment:
Seed Stage: Initial capital for product development and market research.
Seed Stage: Like planting seeds to grow a garden; it’s the beginning when the idea is just starting.
Early Stage: Funding for product launch and initial market entry.
Early Stage: Watering the plants to help them grow a bit more with the first leaves and flowers.
Growth Stage: Capital for expanding market reach and scaling operations.
Growth Stage: The garden is getting bigger, and there are more flowers and plants.
Expansion Stage: Investment to enter new markets or diversify products.
Expansion Stage: Adding new sections to the garden or growing different types of plants.
Investment Types:
Equity Investment: Investors receive ownership shares in the company.
Equity Investment: Friends getting a small part of your toy collection in exchange for helping you organize them.
Debt Investment: Capital is provided as a loan with interest and repayment terms.
Debt Investment: Lending your friend a toy, and they promise to give it back with an extra toy as a thank-you.
Convertible Notes: A form of debt that can convert into equity.
Convertible Notes: Lending your friend a toy, and later they decide to trade it for a share of your toy collection.
Venture Capital: Funding from specialized firms focused on high-growth potential startups.
Venture Capital: Getting help from a special friend who gives you extra toys because they believe your collection will be amazing.
Angel Investment: Individual investors providing funding in exchange for equity.
Angel Investment: A friend giving you toys because they think your collection is special.
Industry Verticals:
Technology Startups: Innovation-focused companies in IT, software, hardware, etc.
Technology Startups: Creating new and cool toys with the latest technology.
Biotech and Healthcare Startups: Companies in the medical and health sciences field.
Biotech and Healthcare Startups: Making toys that help keep everyone healthy and happy.
Consumer Goods and Services: Products and services for end consumers.
Consumer Goods and Services: Toys and things that everyone can use.
Green and Sustainable Startups: Environmentally conscious businesses.
Green and Sustainable Startups: Toys that are good for the environment.
Financial Technology (FinTech): Companies innovating in the financial services sector.
Financial Technology (FinTech): Toys that help with money and buying/selling toys.
Risk Profiles:
High-Risk, High-Reward Investments: Startups with the potential for significant returns but also high risk.
High-Risk, High-Reward Investments: Trying something new that might bring lots of joy but also some challenges.
Low-Risk, Stable Returns: Investments in more established businesses with predictable returns.
Low-Risk, Stable Returns: Choosing things that are more certain and predictable.
Exit Strategies:
Initial Public Offering (IPO): Going public on the stock exchange.
Initial Public Offering (IPO): Sharing your toy collection with many friends by having a big toy show.
Acquisition: Being bought by a larger company.
Acquisition: A big friend liking your toy collection so much that they want to play with it too.
Merger: Combining with another company to form a new entity.
Merger: Combining your toy collection with another friend’s to make an even bigger collection.
Management Buyout (MBO): Current management buys the business from existing owners.
Management Buyout (MBO): You and your friends deciding to buy the toy collection from your parents.
Market Positioning:
Market Leader: Dominant position in the market.
Market Leader: Being the friend everyone looks up to because you have the best toys.
Challenger: Competing aggressively to gain market share.
Challenger: Trying hard to have even cooler toys than the popular friend.
Follower: Adapting to changes and following market trends.
Follower: Playing with toys that are similar to what the popular friend has.
Revenue Models:
Subscription-based: Revenue generated through subscription fees.
Subscription-based: Friends paying a small amount regularly to play with your toys.
Transaction-based: Revenue earned per transaction.
Transaction-based: Friends giving you a little toy every time they borrow one of yours.
Advertising-based: Generating revenue through advertising.
Advertising-based: Getting extra toys from companies that want to show their toys to your friends.
Freemium Model: Offering basic services for free and charging for premium features.
Freemium Model: Letting friends play with your basic toys for free but charging for the special ones.
Geographic Presence:
Local: Operating in a specific region or locality.
Local: Sharing toys with friends in your neighborhood.
National: Expanding operations to cover an entire country.
National: Expanding to share toys with friends all over your country.
Global: Conducting business on an international scale.
Global: Making friends from different countries and sharing toys with them.
Strategic Alliances:
Partnerships: Collaborative agreements with other companies.
Partnerships: Playing together with other friends and sharing toys.
Joint Ventures: Joint business initiatives with shared responsibilities and risks.
Joint Ventures: Doing a big project with another friend and sharing the toys you both get.
Strategic Investments: Investing in other businesses for mutual benefit.
Strategic Investments: Giving toys to a friend’s project because you think it will make your toy collection even better.
Technology Readiness:
Emerging Technologies: Focused on cutting-edge innovations.
Emerging Technologies: Playing with the newest and coolest toys that just came out.
Adopting Established Technologies: Implementing proven technologies for market entry.
Adopting Established Technologies: Choosing toys that are already popular and lots of friends have enjoyed playing with them.
By embracing business taxonomies, engineers can transcend their traditional technical roles and become strategic partners in shaping the direction of their organizations. Their ability to bridge the gap between technical expertise and business acumen makes them invaluable assets in today’s complex and data-driven business environment.
What would you add to this list? Share with me @azeemnow
I am so excited to introduce NFPA – a Network Forensic Processing & Analysis tool!
NFPA – Network Forensic Processing & Analysis
My purpose behind NFPA tool is to provide Cybersecurity analysts a more efficient and automated (“click & forget”) means of executing commonly-used, open-source network forensics utilities and analysis queries against a piece of network evidence (PCAP).
NFPA tool helps optimize investigations by reducing errors that are typically involved in manually processing and analyzing network-based evidence through various popular tools and command-line options.
Using NFPA, an analyst can:
quickly process case evidence through various popular tools and utilities all by a simple script execution
review results from 60+ individual, multi-purpose queries pre-ran again the evidence
view the native output from all of the evidence process utilities – providing the opportunity for any validation or further analysis
All of the above is organized in an easy-to-understand structure which allows the analyst to quickly find answers as well as the authoritative source of those answers.
Here is a quick demo of NFPA in action:
A key requirement when designing NFPA was to keep dependencies as minimum as possible. I wanted to make sure I leverage a platform that is already commonly used by analysts which is pre-configured with all of the necessary tools and capabilities. This would allow analysts to instantly begin their work on investigations and not have to deal with the underlying system engineering.
Additionally, the NFPA is built-in Bash. Which means you do not have to import any specific libraries or run a certain version. Another advantage of using Bash is that you will most likely be able to run NFPA on other Linux distributions (may need to install some purpose-built network forensic tools separately).
The first version of the tool is now available on Github. Please check it out and let me know what you think!