Category Archives: Digital Forensics

How to Quickly Analyze a PCAP File

 I am so excited to introduce NFPA – a Network Forensic Processing & Analysis tool! 

network_security_ediscovery_network_analysis_network_monitor_forensics_tools_pcap_forensics_packet_forensics_capture_wireshark
NFPA – Network Forensic Processing & Analysis

My purpose behind NFPA tool is to provide Cybersecurity analysts a more efficient and automated (“click & forget”) means of executing commonly-used, open-source network forensics utilities and analysis queries against a piece of network evidence (PCAP).

NFPA tool helps optimize investigations by reducing errors that are typically involved in manually processing and analyzing network-based evidence through various popular tools and command-line options. 

Using NFPA, an analyst can:

  1. quickly process case evidence through various popular tools and utilities all by a simple script execution
  2. review results from 60+ individual, multi-purpose queries pre-ran again the evidence
  3. view the native output from all of the evidence process utilities – providing the opportunity for any validation or further analysis

All of the above is organized in an easy-to-understand structure which allows the analyst to quickly find answers as well as the authoritative source of those answers. 

Here is a quick demo of NFPA in action:

A key requirement when designing NFPA was to keep dependencies as minimum as possible. I wanted to make sure I leverage a platform that is already commonly used by analysts which is pre-configured with all of the necessary tools and capabilities. This would allow analysts to instantly begin their work on investigations and not have to deal with the underlying system engineering.

To that end, here is the only dependency:

Additionally, the NFPA is built-in Bash. Which means you do not have to import any specific libraries or run a certain version. Another advantage of using Bash is that you will most likely be able to run NFPA on other Linux distributions (may need to install some purpose-built network forensic tools separately).

The first version of the tool is now available on Github. Please check it out and let me know what you think!

Tagged , , , , , , , , , ,

What your CMD command line security is missing

Here is what your should do to increase your cmd command line security
Gap in Your Command-line Security

I want to write a follow-up on my last post about chain-of-commands not properly being captured by many defensive tools. During further research and testing, I observed that built-in Windows Command line actions are also not captured.

For instance, a simple act of deleting a file from the CMD Command-line is neither captured in SYSMON or in Windows Event logs:

 CMD.EXE > del /f test_file.txt
file_del_cmd

The only event observed in SYSMON for the above action was the following:

del_file

Additionally, nothing notable was observed in Windows Event logs.

This simple act of deleting a file is a common technique used by the adversaries. This action could be done both manually or through malware. One example where this technique is used is in the case of the Robbinhood Ransomware. In this sandbox report, you can see various quite-delete operations that Robbinhood malware executes.

I understand that there are other means of extracting CMD Command-line execution content. However, many of those require digital forensics analysis.

For instance, you can review Command-line history by analyzing the memory capture using a tool such as Volatility with plugins: cmdscan, consoles or just running strings against the memory image. However, this type of analysis requires either a memory image capture or a specialized commercial solution that can scan live memory content (example). Unfortunately, most organizations do not have access to these enterprise-solutions thus their ability to hunt for such Command-line techniques becomes limited.

MITRE ATT&CK Evaluations also has an entry for this technique 9.C.4 File Deletion where you can select various technologies from the drop-down list and see how they detect this technique.

If you are collecting and hunting full CMD Commandline, I would love to hear about your feedback; especially, if the technology/method that you are using is not one of the ones tested in ATT&CK Evaluations above.

https://attackevals.mitre.org/technique_comparison.html?round=APT29&step_tid=9.C.4_T1107&vendors=


Tagged , , , , , ,

Who Else is Blind to Chain-of-Commands | Adversary Technique

photo-1567635102602-73000b63761a

I recently came across a technique that potentially allows the adversary to both execute and evade detection that is simple to execute, however, to my surprise, not entirely captured by detection tools (at least not by those that I have tested).

In this quick post, I will share my findings & analysis and I am interested in any feedback around options for detection.

Technique Description: The adversary executes a custom-developed, chain-of-commands that they execute together as a single command-line using Windows CMD.EXE. This execution could be achieved through malware or the adversary could manually perform it on a system under their control.

One of the key advantages of this technique for the adversary is that, as of this writing, SYSMON (10.0.4.2), and maybe even some commercial EDR solutions, do not capture such chain-of-commands as a single execution. Instead, these tools typically log this activity separately. I found nothing in the SYSMON logs or Windows native event logs that indicate that multiple commands were executed together as part of a chain.

If what I have observed in true, then I think this lack of total context makes it difficult for incident responders, threat hunters, or security monitoring professionals to identify such activity as anomalous among a large number of events. On the other hand, it allows the adversary to hide in plain sight.

Technique Use in Real Malware: One particular malware where I found this technique being used was in the RobbinHood Ransomware. In my analysis of these two samples (1, 2), this chain-of-command technique can be observed in a couple different ways. However, in one specific instance, RobbinHood uses this technique to check for network connectivity, terminates its previously-launched malicious process and subsequently deletes that same process executable quietly from the system permanently. The command itself was as follows:

ping 1.1.1.1 -n 1 -w 3000 > 
& taskkill /f /im steel.exe & Del /f /q ‘C:\Users\user\Desktop\steel.exe’

Atomic Test: To simulate the above technique, I developed this benign chain-of-commands, which essentially, first checks network connectivity by making a single ICMP ping request to a Google’s public DNS address, and then it terminates a running Chrome web browser process.

ping 8.8.8.8 -n 1 -w 3000 > Nul & taskkill /f /im chrome.exe

chain_of_command_atomic_test

Here is what I observed in SYSMON on the atomic test above:

First, you see an entry for PING.EXE portion of the chain-of-command:

ping_sysmon

Second, you see separate entry for the latter portion of the chain where the CHROME.EXE process is terminated:

taskkill_sysmon

It is evident in the SYSMON events above that both processes share the same Parent Process ID. However, while both events share the same ParentProcessID of 12120, there isn’t any explicit indication that these commands were executed together as part of a chain-of-commands. Which I believe is an important context that is missing as it would not only stick-out during Incident Response/Hunt/Monitoring; especially if the system under investigation and has no business purpose to running such chain-of-commands.

I do want to highlight that I think SYSMON is capturing what it is supposed to capture – a process creation. It captured as each process was created on the system; which was separately one at a time. The limitation appears to be at the operating system level where this data is not captured.

I look forward to feedback and how are you detecting this technique in your environments!

Reference:

MalwareReference
Trojan; possibly Big Bang APT1. https://bit.ly/2xaAVNr
2. https://bit.ly/2KBddgp
3. https://bit.ly/3cUVkFH
Raccoon Stealerhttps://bit.ly/35i8dXP
InstallCube Trojanhttps://bit.ly/2yMjmDI
GreenKit Bitcoin Mining Rootkithttps://bit.ly/3aDRI9i
TROJ_VICEPASS.A1. https://bit.ly/2y2PrHr
2. https://bit.ly/2xem5Wm

Tagged , , ,

Free IDS and Full Packet Capture Software

Recently, I have been involved in configuring an Intrusion Detection System IDS (IDS) with full packet capture using the SecurityOnion distribution (distro) in the production environment. Previously, I had set up a SOHO IDS environment when I was learning during the first Compromise, Detect, and Respond (CDR) project. But that IDS deployment was done using a different distro and it also did not have the full packet capture capabilities. So to better familiarize myself with SecurityOnion, I decided to do a quick post about it.

Just in case you are not familiar with SecurityOnion, you can check out their awesome page here. I am not going to try to explain much about the distro itself because my explanation will not do it enough justice. Besides, their website has a whole lot more information than I can provide. They do a great job of explaining how you can start from scratch and have a system up and running in no time. They even go over how you can customize it for your specific environment and maintain the system going forward.

I followed the installation steps here and the post-installation guide here and within an hour, give or take, I had the IDS up and running (including the time it took to download the 1.3GB ISO image over my home connection). And just like my previous labs, the whole setup here was very simple: I used my laptop’s VMware Workstation for the SecurityOnion. I placed the network interface in promiscuous mode to capture traffic from the host. Note: this method typically results in a significant packet loss, however, it is fine for just practice.

NETWORK PROMISCUOUS MODE

Enabling and verifying promiscuous mode configuration

After finishing the IDS configuration, my Snorby screen looked like the above. You will notice that there isn’t much activity here compared to what we saw during the first CDR project. The main reason for this is that in the previous setup we had Metasploit running and had been running exploits, but this setup is a vanilla setup. Nevertheless, it’s pleasing to be able to get basic IDS up and running easily and quickly.

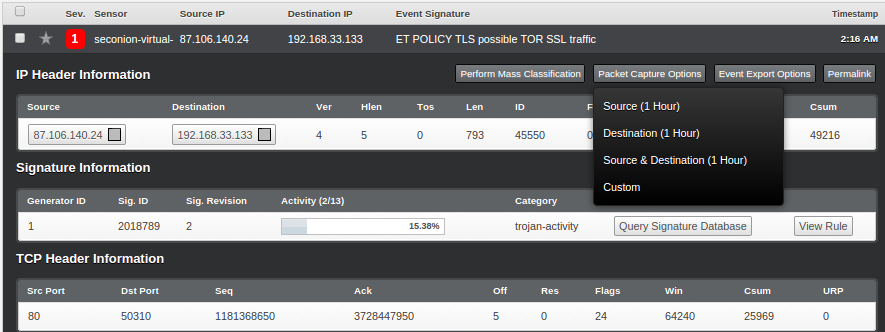
So, in order to generate some interesting IDS alerts, I set up TOR in my test environment, and as you can see, it has triggered some high severity events:
Sample Alert

Now we can select any of the above alerts to view the packet details. Here are the steps for that: Select the event that you want to analyze > Select “Packet Capture Options” on the top right-hand corner > select “Custom” and then “Fetch Packet“.

Packet Analysis

After you have completed the above steps, you will be presented with a new page: “capME!”

CapME

After logging into the new interface above, you will be able to view the assembled packet behind the event. Pretty cool, huh?!

But our IDS interface is only displaying events that have some potential malicious behavior associated with them. However, there are a whole lot of packets stored in the back end of our SecurityOnion server that we can review via the following path: /nsm/sensor_data/seconion-virtual-machine-eth0/dailylogs:

DailyLogs

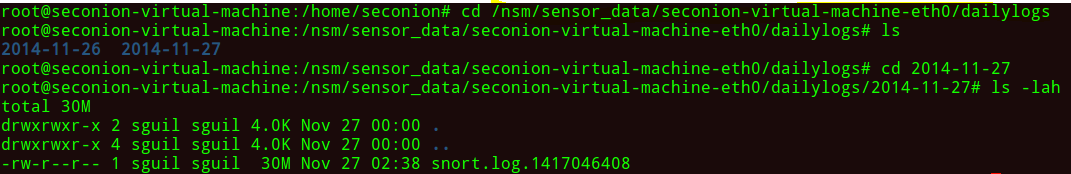
You will now see logs broken up into multiple files. Depending on the volume, you may see several files for each day. In my case, there are only two files (2014-11-27 is the latest and has the most amount of data).

We can open the snot.log.xxxxxxxxx file using a number of tools, e.g. Wireshark, TCPdump, SiLK, Netwitness, etc. I opened mine using Wireshark (depending on the file size and your machine’s power, this may take some time).

TOR traffic was definitely the loudest, making up most of the logs:

Encrypted Traffic

And when we try to reassemble it, this is what we get:

TCP Stream_Encrypted

Enabling and verifying promiscuous mode configuration

But by looking at the Protocol Stats, we notice that there is a bunch of other traffic in this capture as well:

Traffic Protocol Statistics Wireshark Protocol Hierarchy ]

Now, we will do some SiLK kung-fu and see what we can pull out of this capture.
The first step is to open the snot.log.xxxxxxxxx file using Wireshark (or any similar tool) and save it as a new .pcap file. In the second step, I used SiLK’s rwp2yaf2sillk to convert our newly created .pcap file into flow format.

# rwp2yaf2silk –in=1417046408.pcap –out=1417046408.silk

Now, we will go through the basic analysis on our capture using various SiLK commands.

5 largest senders of bytes of data:largest-senders

5 TCP connection per source and destination IP:5-tcp-connections

Show all records from the capture with either a source or destination IP of TOR:specific-ip-find

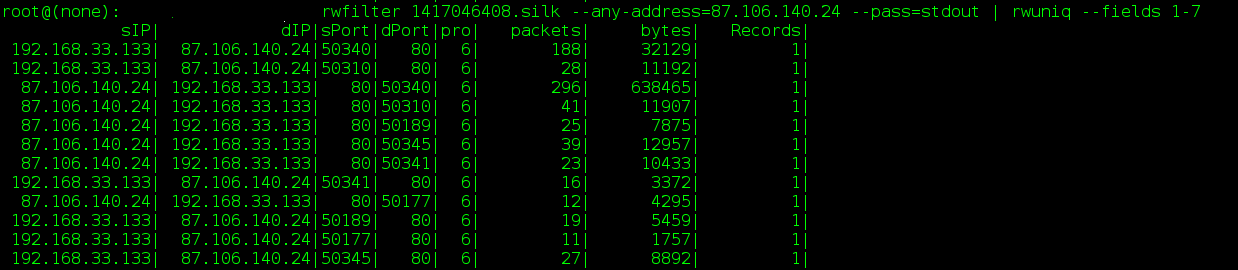
TCP flows with a source IP of our VM and determines the top 5 destination ports by the number of flow records:top-5-destination-ports

Per above output, the majority of our destination ports are 443, with the second largest being port 9001 with 15 total records. Let’s see the amount of data associated with this port:unique-port

Now, as the last step, we will go back to Wireshark and see if we can find the data that is going to port 9001:TCP Port eq 9001
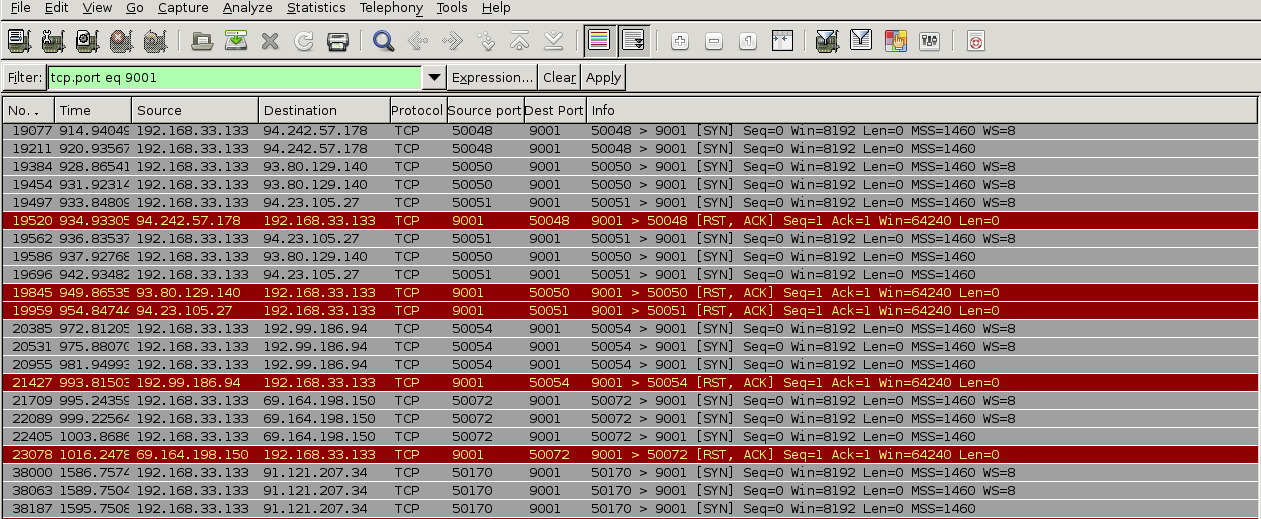
Based on the above, it seems like the traffic generated on port 9001 (default TOR port) are simply connection synchronization attempts followed by erupt connection resets.

Anyway, this concludes my quick walk through on setting up IDS with full packet capture using the SecurityOnion distro.  If you are looking for a great IDS and Full PCAP solution on a shoestring budget, this is it!

Tagged , , , , ,
Advertisements