
Continuation of case 001-01
Response
We already know that our Windows XP machine is compromised so we will proceed with collecting memory of the system. In addition, we will run some sysinternal tools to confirm the network communication to the malicious IP and determine the process which was involved in this communication.
To accomplish this task I used a batch script that I wrote sometime back which utilizes a number of sysinternal tools in conjunction with a raw memory dump tool. In result, we were not only able to collect the raw memory dump of the target machine but we also got access to volatile data that can be quickly analyzed.
First, we will take a look at the volatile (sysinternal) data:
From the response side, the only solid piece of information that we can use to pivot our analysis from is the connection between from our compromised machine (Windows XP @ 10.0.0.15) to the malicious host (Metasploit @ 10.0.0.23). And if you recall, we got this information from the numerous IDS alerts that we received during the Detection step. So based on this, the first volatile data that we will look at is the active connections on our compromised machine.
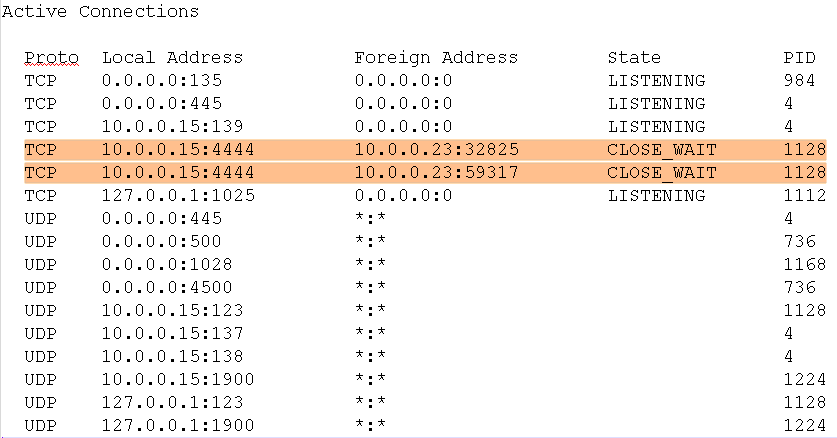
Active Connections
The active connections information above not only further confirms that our XP system is compromised but it also gives us our second pivot point – process ID 1128.
The next thing we find out is the process name associated with PID 1128; we pull the process list of our host:
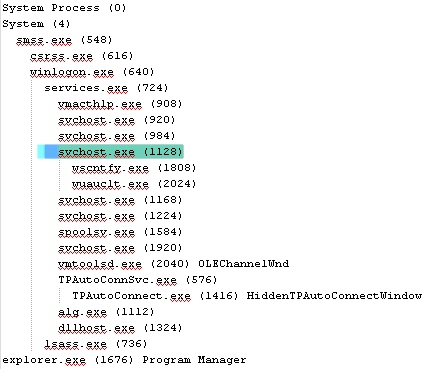
Process List Tree
According to above, the PID 1128 is another instance of SVCHOST.EXE and what is even more interesting is that this process is the parent process of two additional processes: PID 1808 WSCNTFY.EXE and PID 2024 WUAUCLT.EXE.
Pretty quickly we have been able to identify key information from just reviewing the output from our sysinternal tools. Now we’ll get into analyzing the memory dump of our system.
Volatility is what we will use to perform analysis of our system’s memory. First I want to see if there are any additional processes whose parent is PID 1128 SVCHOST.EXE. And in fact, by running the pstree plugin we see that a CMD.EXE process also points back to PID 1128. In addition, we see that our suspicious PID 1128 was spun off by PID 724 SERVICES.EXE.

Volatility Process Scan
The above pstree output is particularly interesting because when we initially reviewed the output of our sysinternal tools we only saw two sub-processes of PID 1128 but there was one more which was missed by our sysinternal tool. Similarly, we want to now use Volatility’s connscan plugin to identify all the connections to and from our malicious 10.0.0.23 IP.

Volatility TCP Connections
We now see that there was total of 6 network connections communicating with our malicious IP. But the good thing is that they were all associated with the same PID. So it seems like all the evil on our machine is related to PID 1128 and it’s sub-processes: PID 1808, PID 2024 and PID 1768. It would be safe to assume that code was injected into PID 1128 SVCHOST.EXT process by our bad guy and then executed the other two malicious processes; we can quickly confirm this:

Volatility Code Injection
Voaltiltiy’s malfind plugin confirms that PID 1128 contains header which looks to be for Microsoft Portable Executable files – thus confirms injected memory section.
Now we are going to look further into the two sub-processes by dumping out every memory section that belongs to them and perform reputation check. First, we’ll take the hash of the processes and check in VirusTotal online database to see if any data on these processes already exist.
PID 1808 WSCNTFY.EXE:
No existing data on this process. After uploading the executable – we received a low number of detection ratio; analysis results.
PID 2024 WUAUCLT.EXE
No existing data on this process. After uploading the executable – we also received a low number of detection ratio; analysis results.
PID 1768 CMD.EXE
No existing data on this process; did not upload the process for further analysis.
Based on the above results – it would be safe to say that a malicious software was not delivered on our machine. (which is true because if you go back and check the Compromise stage 1 & 2 – we did not deliver any malicious content on to our target).
So if a malicious software was not delivered – then what happened? To answer this we will use our systems disk image and create a system timeline. But before we do that – we will try to catch any “low hanging fruits”.
The first thing we did was mount the target system’s image in read-only mode and scan it using couple anti-virus software. In this case, our results came back clean. But if they had come back with any findings those could have been our next lead in the process.
The second thing that I would normally do is “malware footprinting” – this is when you have a piece of suspicious code and you want to see what it does when it is executed. From this, you are able to collect your indicator of compromise (IOCs) and search the rest of your environment for those IOCs. Unfortunately, in this case – we have not found a malicious code and cannot do this process.
However, even though we did not identify any malicious program – we did review the persistence mechanism by looking at the results of our autoruns; output can be found here. The output does not indicate evidence of persistence.
Next up, prefetch. The prefetch analysis of our compromised system also did not provide any additional leads. The primary reason for this is because the majority of the prefetch entries consisted of the sysinternal tools (without even meeting the 128 limit) that we ran during the acquisition setup – thus deemed useless. Copy of the prefetch report here.
Lastly, we look at system’s overall timeline. The timeline for the system also does not jump out with any significant amount of information in terms of how the compromise actually took place. With just using the intelligence that we collected from our memory analysis (src/dst IPs, processes); we did not find any further information that would help us put the picture together of what happened.
On the other hand, when we search for that Important.txt file that we created and then later copied out; there are quite a lot of entries about this file:
time type description
17:59:10 Created C:/Documents and Settings/Administrator/My Documents/Important.txt.txt
17:59:18 $SI […B] time /Documents and Settings/Administrator/Recent/Important.txt.lnk
18:00:17 Modified C:/Documents and Settings/Administrator/My Documents/Important.txt.txt
18:03:51 Access C:/Documents and Settings/Administrator/My Documents/Important.txt.txt
18:03:54 Last Visited/Last Visited visited file:///C:/Documents%20and%20Settings/Administrator/My%20Documents/Important.txt.txt
18:03:54 $SI [MAC.] time /Documents and Settings/Administrator/Recent/Important.txt.lnk
18:03:54 Last Access/Last Access visited file:///C:/Documents%20and%20Settings/Administrator/My%20Documents/Important.txt.txt
18:04:01 Modified C:/Documents and Settings/Administrator/My Documents/Important.txt
18:04:01 $SI […B] time /Documents and Settings/Administrator/My Documents/Important.txt
18:04:01 Created C:/Documents and Settings/Administrator/My Documents/Important.txt
18:04:06 File deleted DELETED C:/Documents and Settings/Administrator/My Documents/Important.txt.txt
18:06:19 Access C:/Documents and Settings/Administrator/My Documents/Important.txt
18:06:19 Last Visited/Last Visited visited file:///C:/Documents%20and%20Settings/Administrator/My%20Documents/Important.txt
18:06:19 File opened Recently opened file of extension: .txt – value: Important.txt
18:06:19 Last Access/Last Access visited file:///C:/Documents%20and%20Settings/Administrator/My%20Documents/Important.txt
18:06:47 $SI [M.C.] time /Documents and Settings/Administrator/My Documents/Important.txt
18:46:47 $SI [.A..] time /Documents and Settings/Administrator/My Documents/Important.txt
The above events clearly indicate the creation of our Important.txt file and the subsequent events show accessing of that file; however – not exactly sure why it shows the file getting deleted at 18:04:06 because we did not delete the file, instead we just copied it over.
So with above – we still have several questions unanswered, however, by the end of our above analysis, we do know that our system was, in fact, communicating with the malicious hosts and several active/inactive connections were found to confirm this finding. In addition, we know that the compromise took place in a very short period of time – in which there does not seem to be any evidence of malicious code being installed, delivered or executed. Based on the system’s web and removable device analysis – we can confirm that the compromise did not take place from these areas. Lastly, we know that during the short timeframe of the compromise the Important.txt file was created (bec we did that during the compromise stage) and accessed numerous times. And while we do not have any further information to confirm that this file was accessed (or copied out)by the malicious source – it would be realizable to assume that whatever was contained in that txt file is potentially compromised.
Case Conclusion
There are couple things I would like to mention as we close out our first case. First, I would like to go over few disclaimers around how this case was set up.
The target XP host and our attacker machine were on the same network with no security measures in place (other than the passive IDS). The XP host had its firewall off and no anti-virus was installed. And this is one of the reasons why we do not have a lot of evidence around what took place in this compromise from the response stage. I was able to extract the XP local event logs, however, probably due to some corruption, was unable to open them for analysis.
Secondly, I believe if we had packet capture capability (or just Netflow) set up during this lab, then we would have been able to confidently determine that Important.txt file was in fact copied out from our XP machine; I plan to have this capability down the road.
The third point that I want to add here is related to the sysinternal batch script that we used during the initial Response stage. Even though the script’s output provided us with useful information very early in the Response stage but as we got closer to system file and timeline analysis we noticed that a lot of our results were polluted with our sysinternal tool executions. An overall lesson learned here.
Lastly, the goal of this exercise was to do a complete cycle of Compromise and Response without carrying over the knowledge between the stages. And for that reason, I did not look into how our selected Metasploit payloads operate and how they copy files over. Because unless our Response artifacts indicated the usage of those payloads (or even Metasploit) – it would have been cheating to use that information during Response.
With that said, I am sure that I overlooked artifacts during my analysis and which could have been the game-changers. And this is the whole point of these exercises, for me to do my best and then let others review what I have done and provided feedback on what I could do better. For this reason, I will be more than happy to share the case images to whoever that wants to take another stab at it. Just send me a message using the form on the contact page and I will share the link for the download. Thanks!

[…] after my last CDR post – for some unrelated reason, I had my main lab system crash and now I have to rebuild […]