I recently came across a technique that potentially allows the adversary to both execute and evade detection that is simple to execute, however, to my surprise, not entirely captured by detection tools (at least not by those that I have tested).
In this quick post, I will share my findings & analysis and I am interested in any feedback around options for detection.
Technique Description: The adversary executes a custom-developed, chain-of-commands that they execute together as a single command-line using Windows CMD.EXE. This execution could be achieved through malware or the adversary could manually perform it on a system under their control.
One of the key advantages of this technique for the adversary is that, as of this writing, SYSMON (10.0.4.2), and maybe even some commercial EDR solutions, do not capture such chain-of-commands as a single execution. Instead, these tools typically log this activity separately. I found nothing in the SYSMON logs or Windows native event logs that indicate that multiple commands were executed together as part of a chain.
If what I have observed in true, then I think this lack of total context makes it difficult for incident responders, threat hunters, or security monitoring professionals to identify such activity as anomalous among a large number of events. On the other hand, it allows the adversary to hide in plain sight.
Technique Use in Real Malware: One particular malware where I found this technique being used was in the RobbinHood Ransomware. In my analysis of these two samples (1, 2), this chain-of-command technique can be observed in a couple different ways. However, in one specific instance, RobbinHood uses this technique to check for network connectivity, terminates its previously-launched malicious process and subsequently deletes that same process executable quietly from the system permanently. The command itself was as follows:
Atomic Test: To simulate the above technique, I developed this benign chain-of-commands, which essentially, first checks network connectivity by making a single ICMP ping request to a Google’s public DNS address, and then it terminates a running Chrome web browser process.
Here is what I observed in SYSMON on the atomic test above:
First, you see an entry for PING.EXE portion of the chain-of-command:
Second, you see separate entry for the latter portion of the chain where the CHROME.EXE process is terminated:
It is evident in the SYSMON events above that both processes share the same Parent Process ID. However, while both events share the same ParentProcessID of 12120, there isn’t any explicit indication that these commands were executed together as part of a chain-of-commands. Which I believe is an important context that is missing as it would not only stick-out during Incident Response/Hunt/Monitoring; especially if the system under investigation and has no business purpose to running such chain-of-commands.
I do want to highlight that I think SYSMON is capturing what it is supposed to capture – a process creation. It captured as each process was created on the system; which was separately one at a time. The limitation appears to be at the operating system level where this data is not captured.
I look forward to feedback and how are you detecting this technique in your environments!
Recently, I have been involved in configuring an Intrusion Detection System IDS (IDS) with full packet capture using the SecurityOnion distribution (distro) in the production environment. Previously, I had set up a SOHO IDS environment when I was learning during the first Compromise, Detect, and Respond (CDR) project. But that IDS deployment was done using a different distro and it also did not have the full packet capture capabilities. So to better familiarize myself with SecurityOnion, I decided to do a quick post about it.
Just in case you are not familiar with SecurityOnion, you can check out their awesome page here. I am not going to try to explain much about the distro itself because my explanation will not do it enough justice. Besides, their website has a whole lot more information than I can provide. They do a great job of explaining how you can start from scratch and have a system up and running in no time. They even go over how you can customize it for your specific environment and maintain the system going forward.
I followed the installation steps here and the post-installation guide here and within an hour, give or take, I had the IDS up and running (including the time it took to download the 1.3GB ISO image over my home connection). And just like my previous labs, the whole setup here was very simple: I used my laptop’s VMware Workstation for the SecurityOnion. I placed the network interface in promiscuous mode to capture traffic from the host. Note: this method typically results in a significant packet loss, however, it is fine for just practice.
Enabling and verifying promiscuous mode configuration
After finishing the IDS configuration, my Snorby screen looked like the above. You will notice that there isn’t much activity here compared to what we saw during the first CDR project. The main reason for this is that in the previous setup we had Metasploit running and had been running exploits, but this setup is a vanilla setup. Nevertheless, it’s pleasing to be able to get basic IDS up and running easily and quickly.
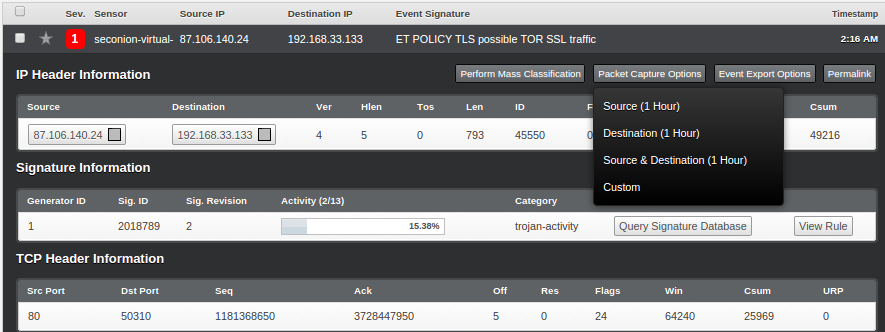
So, in order to generate some interesting IDS alerts, I set up TOR in my test environment, and as you can see, it has triggered some high severity events:
Now we can select any of the above alerts to view the packet details. Here are the steps for that: Select the event that you want to analyze > Select “Packet Capture Options” on the top right-hand corner > select “Custom” and then “Fetch Packet“.
After you have completed the above steps, you will be presented with a new page: “capME!”
After logging into the new interface above, you will be able to view the assembled packet behind the event. Pretty cool, huh?!
But our IDS interface is only displaying events that have some potential malicious behavior associated with them. However, there are a whole lot of packets stored in the back end of our SecurityOnion server that we can review via the following path: /nsm/sensor_data/seconion-virtual-machine-eth0/dailylogs:
You will now see logs broken up into multiple files. Depending on the volume, you may see several files for each day. In my case, there are only two files (2014-11-27 is the latest and has the most amount of data).
We can open the snot.log.xxxxxxxxx file using a number of tools, e.g. Wireshark, TCPdump, SiLK, Netwitness, etc. I opened mine using Wireshark (depending on the file size and your machine’s power, this may take some time).
TOR traffic was definitely the loudest, making up most of the logs:
And when we try to reassemble it, this is what we get:
Enabling and verifying promiscuous mode configuration
But by looking at the Protocol Stats, we notice that there is a bunch of other traffic in this capture as well:
Wireshark Protocol Hierarchy ]
Now, we will do some SiLK kung-fu and see what we can pull out of this capture.
The first step is to open the snot.log.xxxxxxxxx file using Wireshark (or any similar tool) and save it as a new .pcap file. In the second step, I used SiLK’s rwp2yaf2sillk to convert our newly created .pcap file into flow format.
Now, we will go through the basic analysis on our capture using various SiLK commands.
5 largest senders of bytes of data:
5 TCP connection per source and destination IP:
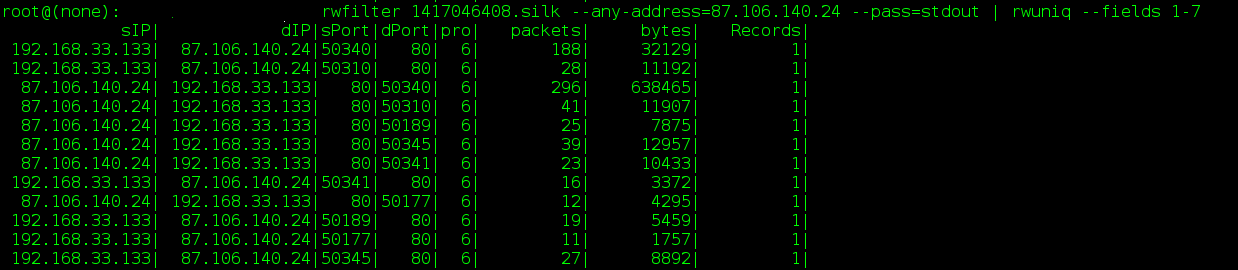
Show all records from the capture with either a source or destination IP of TOR:
TCP flows with a source IP of our VM and determines the top 5 destination ports by the number of flow records:
Per above output, the majority of our destination ports are 443, with the second largest being port 9001 with 15 total records. Let’s see the amount of data associated with this port:
Now, as the last step, we will go back to Wireshark and see if we can find the data that is going to port 9001:Based on the above, it seems like the traffic generated on port 9001 (default TOR port) are simply connection synchronization attempts followed by erupt connection resets.
Anyway, this concludes my quick walk through on setting up IDS with full packet capture using the SecurityOnion distro. If you are looking for a great IDS and Full PCAP solution on a shoestring budget, this is it!
Above is in response to COVID19 – valid until May 15, 2020.
—————————————————————
The process of timeline creation is extremely critical in forensic because it provides you with a holistic view of the system in question and gets you one step closer to answering those key questions. There are multiple ways that you can create a system’s timeline. However, the one I recently came to know is Autopsy’s Timeline Analysis module and here is my first experience with it.
Autopsy can be downloaded from here. The installation is simple – no dongle required!
Welcome Screen
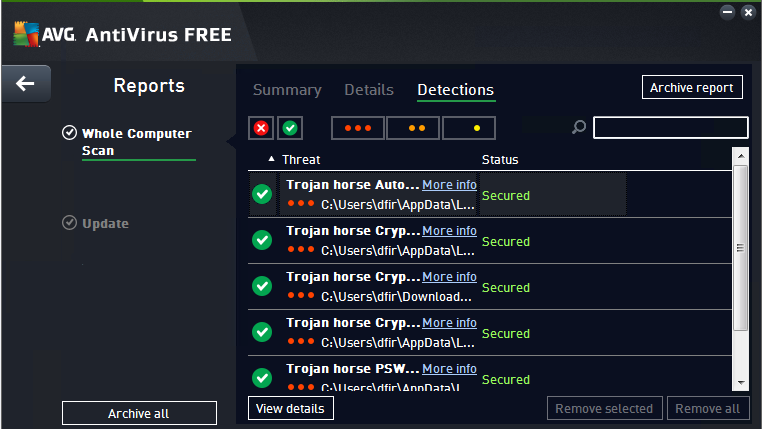
To test the timeline module, I used one of my test windows 7 machines. And to create some activity, I browsed the known-bad-URLs and downloaded some potentially malicious files. Also, installed AVG AntiVirus Free edition as a basic detection mechanism. However, to my surprise, AVG was able to detect and block most of the executables that I tried to run.
Since I had to run some executable to create the lab, so instead of making exceptions in AVG – I decided to uninstall it. I figured it would be interesting to see how the evidence of software uninstall will be presented.
I went back and ran the following three executables: sydzcr22.exe, b.exe, b01.exe.
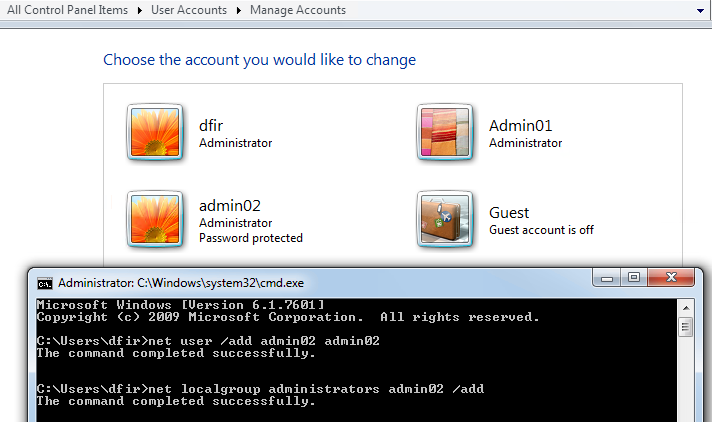
In addition, I added the total of two new accounts on this machine. First, one (admin01) I created using the windows “Manage Accounts” interface and the second (admin02) via command prompt. Both accounts have administrative privileges.
Lastly, I made a logical image of the target system and created a new case in Autopsy. Here is a guide on how to create a case and add evidence in Autopsy.
This is how the output after the initial processing is completed looks like:
As you will notice from the screenshot above, a lot of the common places that you would want to look in an image are readily available in a nice, organized manner. The first thing I did was perform keyword searches for the three executables that I ran earlier (sydzcr22.exe, b.exe, b01.exe) just to confirm their presence.
The keyword search was pretty fast and it found all the three exe files that I had browsed and installed. In the screenshot we can see the exes’ browsed URL, date, and the location on the disk where that piece of evidence is located; index.dat. I searched the Temporary Internet Files but was only able to find one B01.exe but not others; not sure why.
The second thing I wanted to look for is the installation of the AVG antivirus and then the removal. Let’s see what we find.
The first place I looked at was the “Installed Programs” menu option:
I do not see any instance of AVG here. But regardless, I guess this is a handy feature to have quick access to in order to see the installed applications at the time the image was acquired. I see the AVG2015 folder under Program Data directory but not much more:
So with this, now we get to the reason why we started this project – timeline! The process for generating a timeline is pretty simple. You go to Tools and the Timeline. You see a status bar and at least for my image (120G) it took around 2-3 minutes and I had my timeline opened in the second window:
Graph Legend
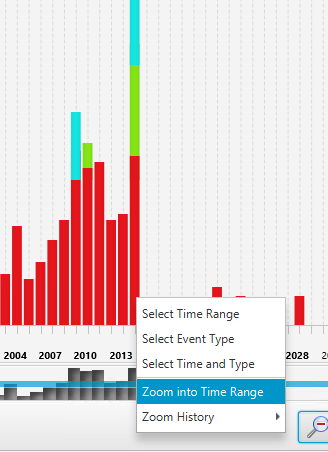
As you will notice in the second screenshot above, there are some anomalies in the time range. You can easily modify the scope by using the scale on the top left, the start and end (not shown in the screenshot) options towards the middle of the screen as well as using the graph itself to zoom into the date of interest. From all of these options, the one that I liked the most is right-clicking on the time range of your interest and select the “Zoom into Time Range” options. In my option this is faster and easier than messing with the scales:
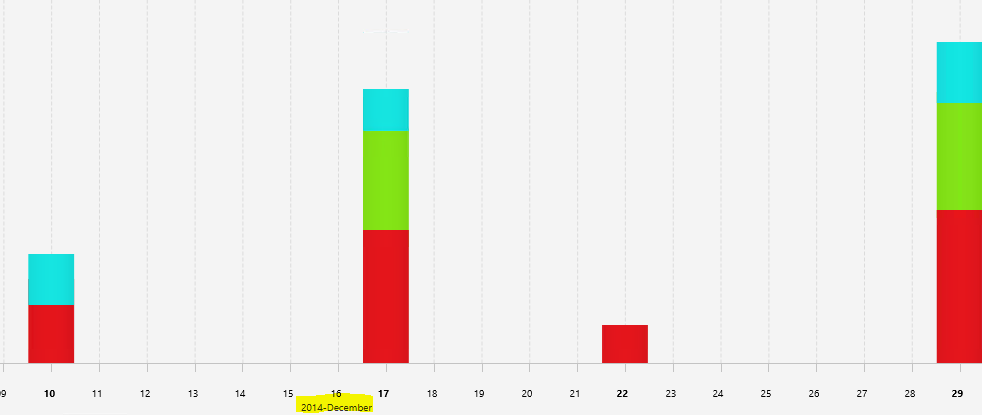
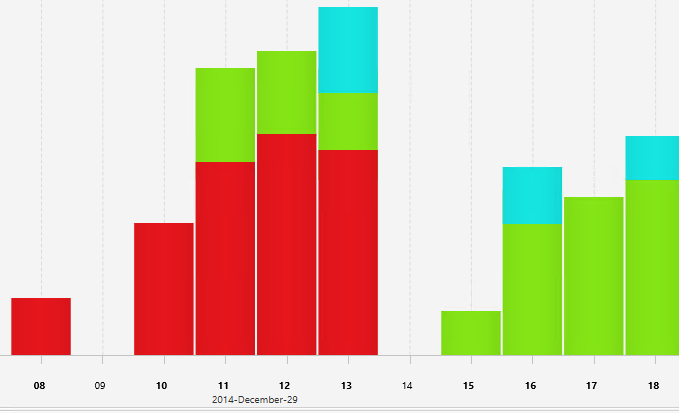
As you continue to zoom in you will get to the month timeframe where you can see which date of the month had what amount of events:
Lastly, when you zoom into one specific day of the month you can see the events by the hour:
So getting back to finding AVG activity, I first see the web activity
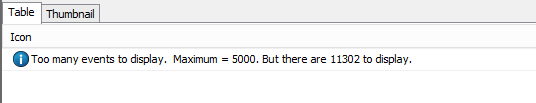
In the screenshot above, please take a note of the “Text Filter” option; which comes handy in narrowing down results. In fact, if you don’t narrow down the results the system will not be able to display the events and instead will give the following message:
However, it seems like if you change the “Visualization Mode” from “Count” to “Details” you are able to overcome the above limitation. However, the output is in a different format:
Notice above that when you hover over any of the events, you receive the option for further details by the symbols of “+” and “-“. However, after spending some time going through the information presented above, I did not get close to finding answers to the original questions. This is not to say that information here is not valuable, it just did not come handy in answering our particular questions.
So my next step was to extract windows event logs from the image and review them. And pretty quickly we find the following entries:
AVG Installation Completed Successfully AVG Installation Successful Without Errors
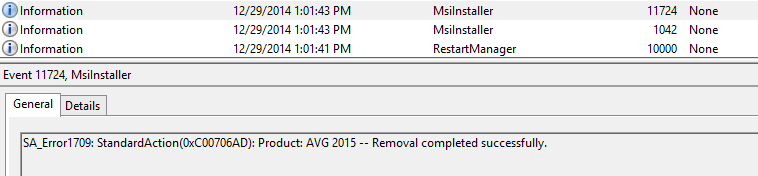
Similarly, we find log entries for removal:
AVG Successful Removal Without Errors AVG Removal Completed Successfully
With the information presented from our target system’s event logs, we are now able to see both the successful installation and later the removal of the AVG anti-virus software. It would have been nice to see some of the event log information in our timeline.
On a side note, while looking through application logs, I found two application crash events; one for our b.exe and the second for sydzcr22.exe – both of which we attempted to install from the browser earlier in the lab.
b.exe Application Crash
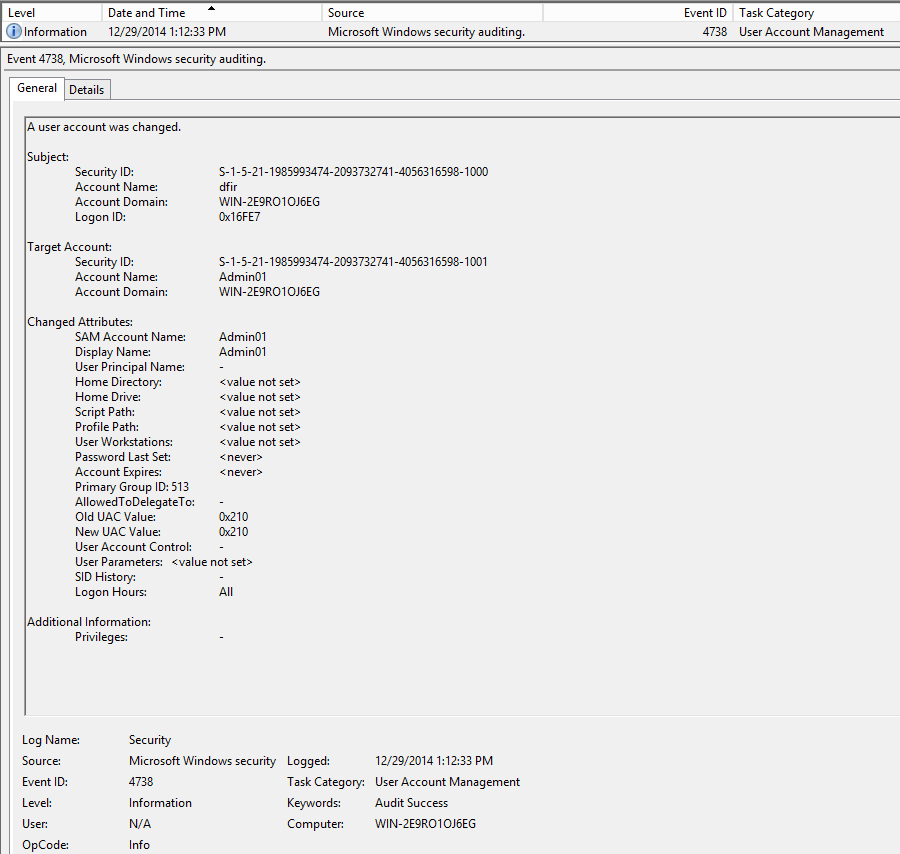
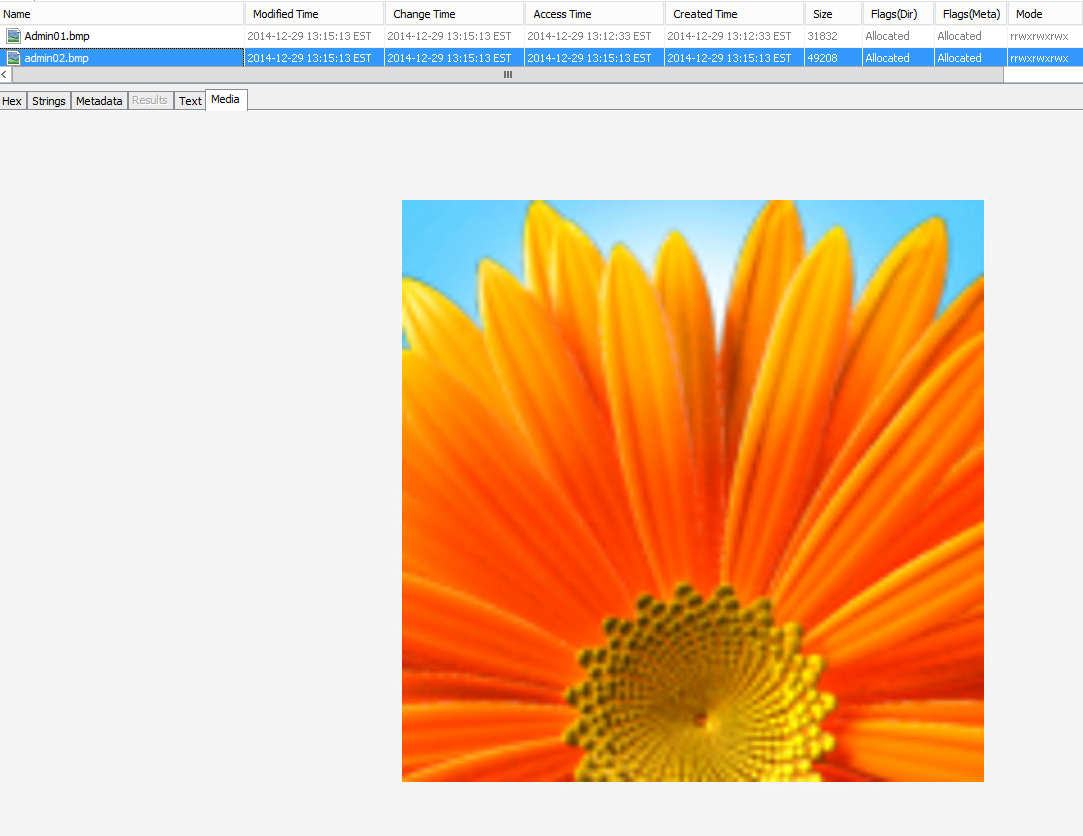
The last question that we wanted to answer was the evidence of account creation for admin01 and admin02. Both of which we created earlier – one using Windows Account Management interface and the second via command prompt. Here is the windows log event for the first one:
Here is the evidence of the second account creation:
Based on the above to account creation logs, we cannot tell which account was created via windows interface vs command prompt. The only difference that we see is that one account has its password set (which is the account we created through command prompt and had to give it a password but without this knowledge we cannot tell the difference). Also, the account created from the command prompt (admin02) does not have the “Display Name” set; maybe this could be an identifier.
On a separate note, if we go back to our timeline and see the events around the time frame of the above windows events we see the following activity.
If you look at that first entry, it refers to the following default account display picture:
Around the same time we see security logs getting updated:
This is all the information that I can pick out from our timeline that I think is there to indicate the creation of an account. However, what’s interesting is that in our timeline we do not see any entry to command prompt – which we used to create the second account and if there was an entry for it, it could be used as another hint.
Anyway, at this point, I was not sure how to go about getting user account artifacts so I reached out to the people of DFIR community via Twitter and as always got wonderful feedback. One of the suggestions was to perform shellbag analysis. This was a great suggestion however, this was not going to work in our situation. The reason being, shellbag analysis requires two artifacts for each account: ntuser.dat and usrclass.dat. These two artifacts are created the first time the user interactively logs on at the computer; establishing a user account on the computer does not create a profile for that user. In our case, we did not login using either of the (admino1, admin02) accounts after we created them, hence there aren’t any profile files like there are for our main (dfir) account:
Some of the other suggestions included examining memory of the target system (which we did not acquire) and reviewing windows command line history (which is not saved by default on the disk running Win7-32 but again could have pulled from memory).
So the last thing I wanted to check out before closing out this lab was to do a quick comparison with traditional log2timeline. So I ran l2t against the same disk image and here is the outcome of our super timeline:
There is a lot that is going on here but the key things to look at is when the two accounts are created and what happens to them. The first account (admin01 – created via GUI) is underlined in red and the second account (admin02 – created via cmd) is underlined in blue. The section marked in green shows the launch of command prompt. It is obvious that the first account was created right after the creation of few security event logs however, the second account was created right after the launch of windows command prompt (there is some delay in seconds but that was due to me confirming the cmd line syntax before executing).
The last thing I want to point out from our super timeline – which correlates with our earlier finding during the manual review of event logs and is the small section in the screenshot above highlighted in yellow. You will notice that for the first account, admin01 there is an account name right next to the SAM ID of the same name. However, for the second account we just see the SAM ID but no account name.
This concludes my exploration of Autopsy and its timeline feature. The goal here was not to simply go through the different menu options of this powerful tool but rather run it against a made up scenario. And even the scenario itself is something that I made up as I went along in the process; so to be honest, I am not sure how some of the other (even commercial) tools would handle this scenario. In the end, the whole post became another CDR entry where we almost went through all the three stages to an extent. Anyway, it took me some time to gather all the screenshots and do this write up from the time when I actually did the lab; so I am sure numerous updates have been made to the tool since then. Overall, I am very pleased with the tool and the capabilities that it provides; hard to believe its free! When I did the lab, the timeline feature was fairly a new addition to the tool but we can surely expect some awesome updates to it. Definitely, an awesome, powerful and fast tool to have in your toolbox – check it out!
(Here is the update on user account creation analysis done by @b!n@ry – Great job!; instead of looking for usrclass.dat for the new accounts created, you would look into the account you suspect created those two new accounts! Ref: 1 and 2. Also the net.exe and net1.exe prefetch files proved to be extremely valuable). #NoteToSelf! :)
The other day I was trying to image a physical 250GB desktop hard drive using FTK Imager but I continued to get the following error under status: Failed: The specified network name is no longer available. This was the first time that I received this error so first I was not sure what caused it. Here was my setup:
The error was little random in that it would fail at different places – anywhere between 2% – 13%. My first thought was that the docking station was bad; so I took out my WiebeTech write-blocker and attempted to image the drive again. But I received the same error at 6%. At this point, I knew that the docking station was fine and that the problem had to be with either the FTK Imager software, Windows Server 2012 (my first time using Server 2012 during imagining) or the USB hub. I decided to start with the hub; I unplugged the docking station from the hub and connected it directly to the server’s USB port – skipping the hub completely. I started FTK Imager and began the imagining process – and to my surprise, the imaging completed without any errors!
From the 7 ports provided by the hub, only one port was being utilized (connected only to the docking station) eliminating the possibility of the overwhelmed hub. In fact, the hub worked fine when I copied large operating system .iso files from an external hard drive to the server. So, I am not sure where the problem is the hub but in this situation, I was unable to image a relatively small hard drive due to this hub.


 Wireshark Protocol Hierarchy ]


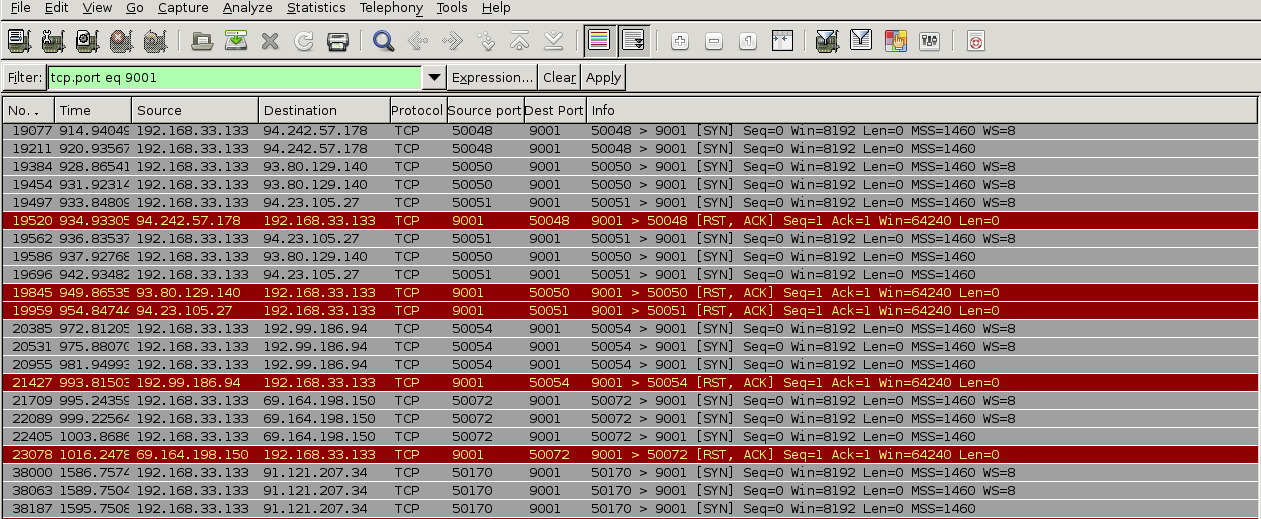 Based on the above, it seems like the traffic generated on port 9001 (default TOR port) are simply connection synchronization attempts followed by erupt connection resets.