How does it feel to know that your personal computer can be remotely controlled by someone without your knowledge for ill purposes? Or worse, instead of a single individual having this unauthorized access to your system it can be a group of people over the internet that controls what your computer does and how it does it. In the field of Information Security, if your system is involved in such control it is considered a bot: a computer system being controlled by an automated malicious program. In addition, your computer system can be part of a larger group of infected computer systems and these collections of infected computers create botnets. Casually, these bots are also referred to as zombies and the remote controller is called the botmaster. So how are these bots born and grow into botnets?
According to Damballa, an independent security firm’s annual threat report, “at its peak in 2010, the total number of unique botnet victims grew by 654 percent, with an average incremental growth of 8 percent per week ”. Originally, these bots are developed by tech-savvy criminals who develop the malicious bot code and then usually release on the open internet. While on the internet, the bot can perform numerous malicious functions based on its code design but it most cases it spreads itself across the internet by searching for vulnerable, unprotected computers to infect. After compromising victims’ computers, these bots quickly hide their presence in difficult to find locations, such as computer operating system files. The botmaster’s goal here is to maintain the compromised system behavior as normal as possible so the victim does not become suspicious. Common activities that bots perform at this stage involve registering themselves as the trusted program in any anti-virus program that might be on the victim’s computer. Moreover, to maintain persistence, bots add their operations in systems startup functions which results in bots automatically reactivating even after shutdown/restart. Throughout this process, bots continue to report back to the botmaster and wait for further instructions.
Below lists some of the common operations that bots can perform on behalf of its botmaster:
Sending
Stealing
DoS (Denial of Service)
Clickfraud
They send
– spam
– viruses
– spyware
They steal personal and private information and communicate it back to the malicious user:
– credit card numbers
– bank credentials
– other sensitive personal information
Launching denial of service (DoS) attacks against a specified target. Cybercriminals extort money from Web site owners, in exchange for regaining control of the compromised sites.
Fraudsters use bots to boost Web advertising billings by automatically clicking on Internet ad
As the chart above states, there are numerous functions that bots can perform. However, recently bots have mainly been used to conduct Distributed Denial of Service (DDoS) attacks: utilizing hundreds or thousands of bots from around the whole world against a single target. Botmaster’s goal with DDoS is to use thousands of bots with numerous botnets to attempt to access the same resource simultaneously. This overwhelms the resource with thousands of requests per second thus making the resource unreachable. This inaccessibility of the resource has severe effects on legitimate users and requests. According to FBI, “botnet attacks have resulted in the overall loss of millions of dollars from financial institutions and other major U.S. businesses. They’ve also affected universities, hospitals, defense contractors, law enforcement, and all levels of government”.
A misconception exists that if your system does not hold any valuable information or if you do not use your system to conduct online financial transactions than an adversary is less likely to target your system. Unfortunately, as much as we would like this to be true, it is not the case. For botnets, the most valuable element is your system’s storage and your internet speed. Our personal computers are now capable of storing and processing terabytes of information seamlessly and are able to use our high-speed internet to transfer this information. As stated by a malware researcher team from Dell SecureWorks, botnets “allows a single person or a group to leverage the power of lots of computers and lots of bandwidth that they wouldn’t be able to afford on their own”.
Above is in response to COVID19 – valid until May 15, 2020.
—————————————————————
The process of timeline creation is extremely critical in forensic because it provides you with a holistic view of the system in question and gets you one step closer to answering those key questions. There are multiple ways that you can create a system’s timeline. However, the one I recently came to know is Autopsy’s Timeline Analysis module and here is my first experience with it.
Autopsy can be downloaded from here. The installation is simple – no dongle required!
Welcome Screen
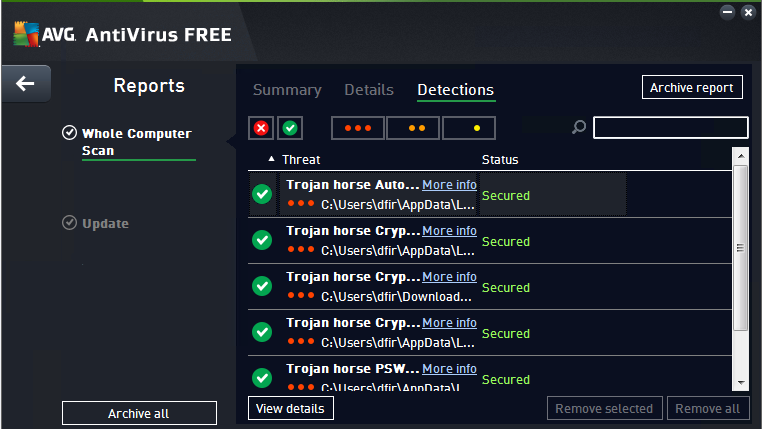
To test the timeline module, I used one of my test windows 7 machines. And to create some activity, I browsed the known-bad-URLs and downloaded some potentially malicious files. Also, installed AVG AntiVirus Free edition as a basic detection mechanism. However, to my surprise, AVG was able to detect and block most of the executables that I tried to run.
Since I had to run some executable to create the lab, so instead of making exceptions in AVG – I decided to uninstall it. I figured it would be interesting to see how the evidence of software uninstall will be presented.
I went back and ran the following three executables: sydzcr22.exe, b.exe, b01.exe.
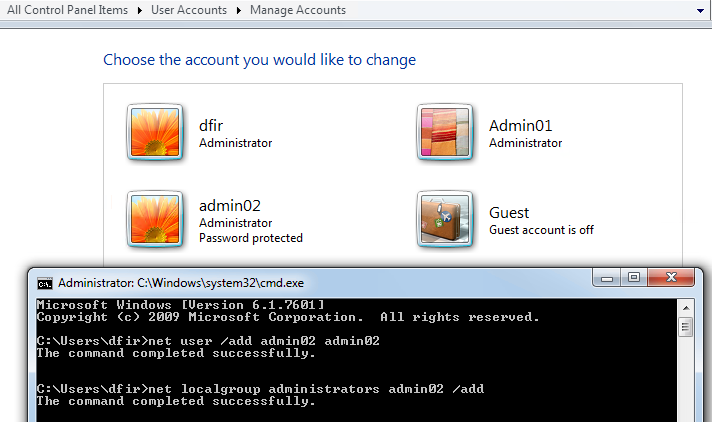
In addition, I added the total of two new accounts on this machine. First, one (admin01) I created using the windows “Manage Accounts” interface and the second (admin02) via command prompt. Both accounts have administrative privileges.
Lastly, I made a logical image of the target system and created a new case in Autopsy. Here is a guide on how to create a case and add evidence in Autopsy.
This is how the output after the initial processing is completed looks like:
As you will notice from the screenshot above, a lot of the common places that you would want to look in an image are readily available in a nice, organized manner. The first thing I did was perform keyword searches for the three executables that I ran earlier (sydzcr22.exe, b.exe, b01.exe) just to confirm their presence.
The keyword search was pretty fast and it found all the three exe files that I had browsed and installed. In the screenshot we can see the exes’ browsed URL, date, and the location on the disk where that piece of evidence is located; index.dat. I searched the Temporary Internet Files but was only able to find one B01.exe but not others; not sure why.
The second thing I wanted to look for is the installation of the AVG antivirus and then the removal. Let’s see what we find.
The first place I looked at was the “Installed Programs” menu option:
I do not see any instance of AVG here. But regardless, I guess this is a handy feature to have quick access to in order to see the installed applications at the time the image was acquired. I see the AVG2015 folder under Program Data directory but not much more:
So with this, now we get to the reason why we started this project – timeline! The process for generating a timeline is pretty simple. You go to Tools and the Timeline. You see a status bar and at least for my image (120G) it took around 2-3 minutes and I had my timeline opened in the second window:
Graph Legend
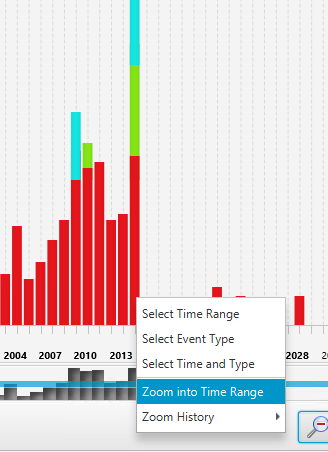
As you will notice in the second screenshot above, there are some anomalies in the time range. You can easily modify the scope by using the scale on the top left, the start and end (not shown in the screenshot) options towards the middle of the screen as well as using the graph itself to zoom into the date of interest. From all of these options, the one that I liked the most is right-clicking on the time range of your interest and select the “Zoom into Time Range” options. In my option this is faster and easier than messing with the scales:
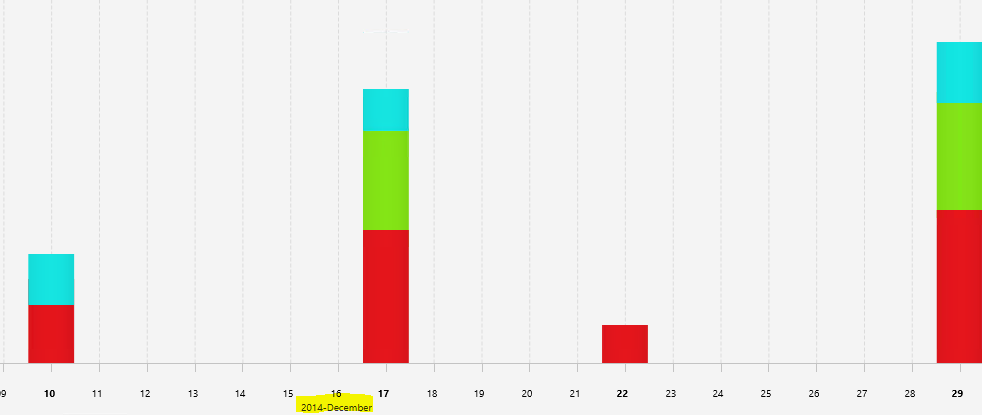
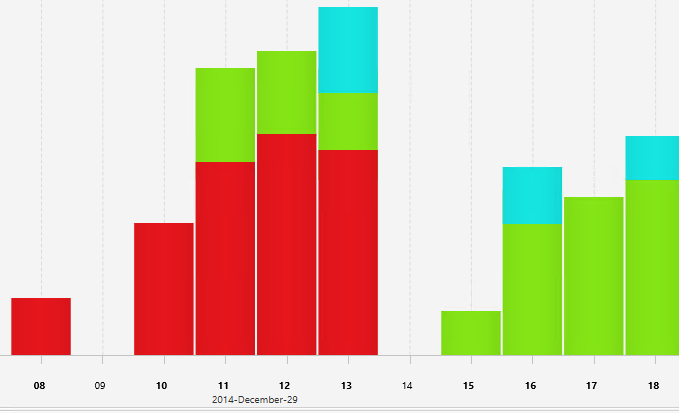
As you continue to zoom in you will get to the month timeframe where you can see which date of the month had what amount of events:
Lastly, when you zoom into one specific day of the month you can see the events by the hour:
So getting back to finding AVG activity, I first see the web activity
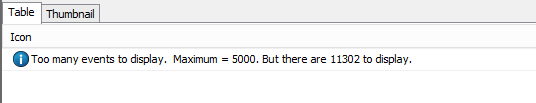
In the screenshot above, please take a note of the “Text Filter” option; which comes handy in narrowing down results. In fact, if you don’t narrow down the results the system will not be able to display the events and instead will give the following message:
However, it seems like if you change the “Visualization Mode” from “Count” to “Details” you are able to overcome the above limitation. However, the output is in a different format:
Notice above that when you hover over any of the events, you receive the option for further details by the symbols of “+” and “-“. However, after spending some time going through the information presented above, I did not get close to finding answers to the original questions. This is not to say that information here is not valuable, it just did not come handy in answering our particular questions.
So my next step was to extract windows event logs from the image and review them. And pretty quickly we find the following entries:
AVG Installation Completed Successfully AVG Installation Successful Without Errors
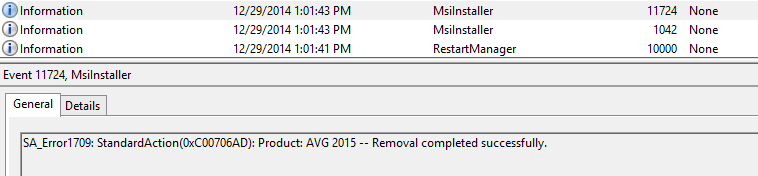
Similarly, we find log entries for removal:
AVG Successful Removal Without Errors AVG Removal Completed Successfully
With the information presented from our target system’s event logs, we are now able to see both the successful installation and later the removal of the AVG anti-virus software. It would have been nice to see some of the event log information in our timeline.
On a side note, while looking through application logs, I found two application crash events; one for our b.exe and the second for sydzcr22.exe – both of which we attempted to install from the browser earlier in the lab.
b.exe Application Crash
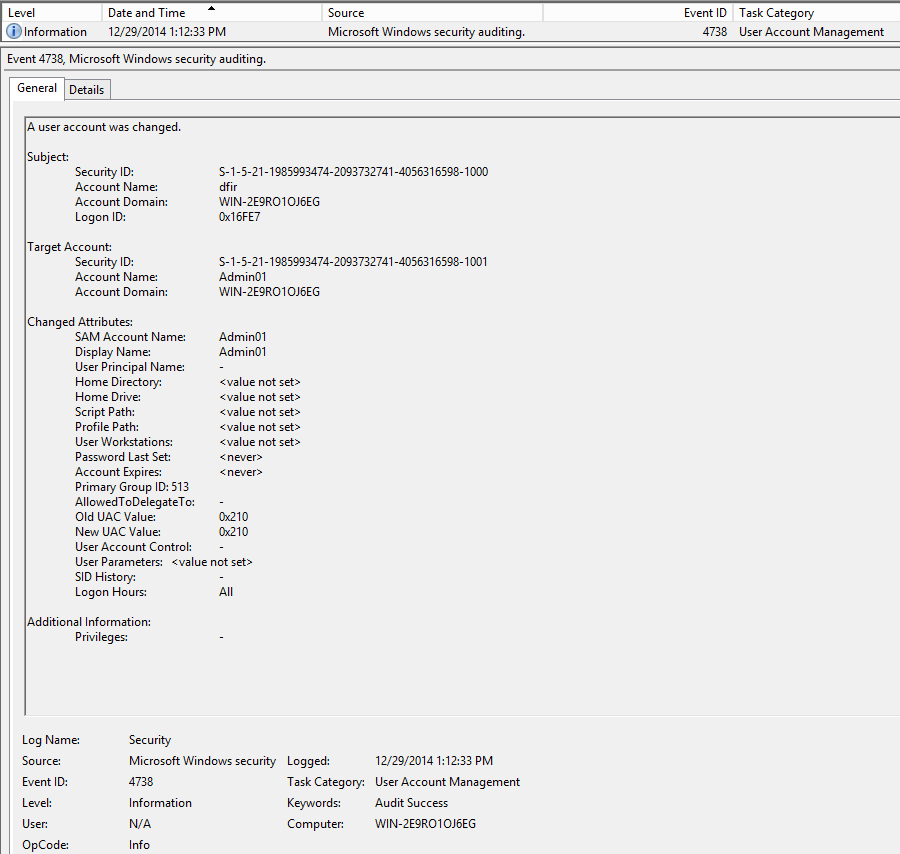
The last question that we wanted to answer was the evidence of account creation for admin01 and admin02. Both of which we created earlier – one using Windows Account Management interface and the second via command prompt. Here is the windows log event for the first one:
Here is the evidence of the second account creation:
Based on the above to account creation logs, we cannot tell which account was created via windows interface vs command prompt. The only difference that we see is that one account has its password set (which is the account we created through command prompt and had to give it a password but without this knowledge we cannot tell the difference). Also, the account created from the command prompt (admin02) does not have the “Display Name” set; maybe this could be an identifier.
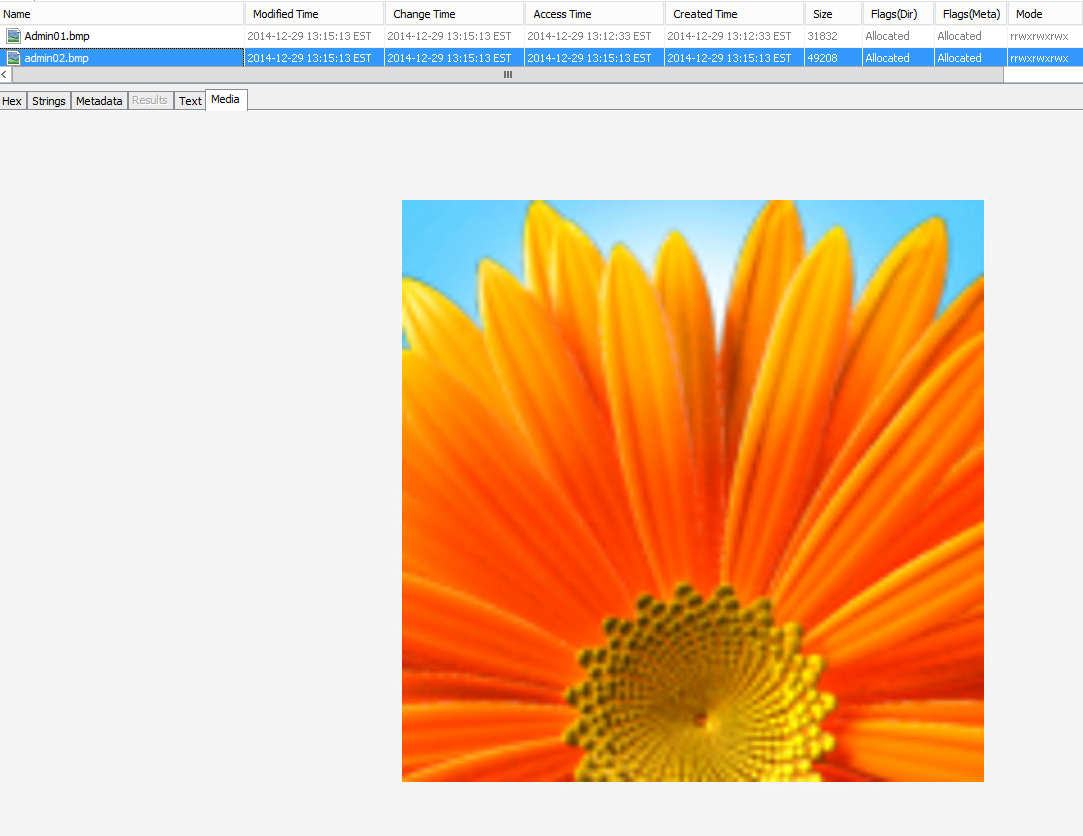
On a separate note, if we go back to our timeline and see the events around the time frame of the above windows events we see the following activity.
If you look at that first entry, it refers to the following default account display picture:
Around the same time we see security logs getting updated:
This is all the information that I can pick out from our timeline that I think is there to indicate the creation of an account. However, what’s interesting is that in our timeline we do not see any entry to command prompt – which we used to create the second account and if there was an entry for it, it could be used as another hint.
Anyway, at this point, I was not sure how to go about getting user account artifacts so I reached out to the people of DFIR community via Twitter and as always got wonderful feedback. One of the suggestions was to perform shellbag analysis. This was a great suggestion however, this was not going to work in our situation. The reason being, shellbag analysis requires two artifacts for each account: ntuser.dat and usrclass.dat. These two artifacts are created the first time the user interactively logs on at the computer; establishing a user account on the computer does not create a profile for that user. In our case, we did not login using either of the (admino1, admin02) accounts after we created them, hence there aren’t any profile files like there are for our main (dfir) account:
Some of the other suggestions included examining memory of the target system (which we did not acquire) and reviewing windows command line history (which is not saved by default on the disk running Win7-32 but again could have pulled from memory).
So the last thing I wanted to check out before closing out this lab was to do a quick comparison with traditional log2timeline. So I ran l2t against the same disk image and here is the outcome of our super timeline:
There is a lot that is going on here but the key things to look at is when the two accounts are created and what happens to them. The first account (admin01 – created via GUI) is underlined in red and the second account (admin02 – created via cmd) is underlined in blue. The section marked in green shows the launch of command prompt. It is obvious that the first account was created right after the creation of few security event logs however, the second account was created right after the launch of windows command prompt (there is some delay in seconds but that was due to me confirming the cmd line syntax before executing).
The last thing I want to point out from our super timeline – which correlates with our earlier finding during the manual review of event logs and is the small section in the screenshot above highlighted in yellow. You will notice that for the first account, admin01 there is an account name right next to the SAM ID of the same name. However, for the second account we just see the SAM ID but no account name.
This concludes my exploration of Autopsy and its timeline feature. The goal here was not to simply go through the different menu options of this powerful tool but rather run it against a made up scenario. And even the scenario itself is something that I made up as I went along in the process; so to be honest, I am not sure how some of the other (even commercial) tools would handle this scenario. In the end, the whole post became another CDR entry where we almost went through all the three stages to an extent. Anyway, it took me some time to gather all the screenshots and do this write up from the time when I actually did the lab; so I am sure numerous updates have been made to the tool since then. Overall, I am very pleased with the tool and the capabilities that it provides; hard to believe its free! When I did the lab, the timeline feature was fairly a new addition to the tool but we can surely expect some awesome updates to it. Definitely, an awesome, powerful and fast tool to have in your toolbox – check it out!
(Here is the update on user account creation analysis done by @b!n@ry – Great job!; instead of looking for usrclass.dat for the new accounts created, you would look into the account you suspect created those two new accounts! Ref: 1 and 2. Also the net.exe and net1.exe prefetch files proved to be extremely valuable). #NoteToSelf! :)
My last blog post was related to setting up Nessus home edition scanner for your lab to do testing. Nessus is properly what I am most familiar with and I like it. I also have some experience using Qualys scanner but it has been couple years since I have used it. However, the scanning technology that I have only heard of but never actually used is Nexpose. So for that reason, I figured I give it a try.
Similar to other commercial scanning technologies, there is a community edition of Nexpose that you can download in your home lab for testing from here.
They have a pretty straightforward user/installation guide here, which I followed in my installation. But just in-case, here is the high-level overview of how I did my setup.
Selected the VMWare Virtual Appliance option of the Community Edition
Completed the online forum and received the activation code in the email
The download contains 1.02GB of .ova file called NexposeVA.ova
I opened that file using VMWare Workstation
Please note that by default, it allocates 8GB of memory, 2 processors and 160GB of disk space. So, please modify these settings if you do not have those resources available before you power-on the VM.
After the VM completely boots, you will login using the following credentials: login: nexpose password: nexpose (please change this)
If you just want to complete the most basic setup and want to get up and running immediately without messing with any of the advanced configurations or upgrades, the only configuration you need to do is networking. The virtual appliance is set up in bridge mode by default and should be able to get you an IP automatically. But if you need to give it static IP then you will have to do that manually.
At this point, you are pretty much done with the setup. You will be able to complete the rest of the setup by accessing your Nexpose instance by typing following in your browser: https[:]//[VM-IP-Address]:3780
The default username for the web interface is: nxadmin and the password is: nxpassword
After your first login, the initialization process will take some time. For me, it was about 5-7 minutes.
Unfortunately, after my last CDR post – for some unrelated reason, I had my main lab system crash and now I have to rebuild most of the different lab machines that I had before. Obviously, this is a little frustrating because I had everything set up the way I wanted it and now I have to pretty much start from scratch. But to make this rebuilding process more pleasant and productive, I think I am going to document and share some of the labs that I am going to build. Most of these are going to be pretty simple to set up without much difficulty using VMware Workstation. I am not going to go over setting up VMware Workstation since there are already a ton of YouTube videos on it.
First, we are going to select the platform that we are going to use for most of these machines – our choice: Ubuntu 13 Desktop.
The first tool that we are going to install is the Nessus vulnerability scanner. In the first CDR project, we used Nessus as one of our reconnaissances tools along with Nmap. However, this tool can be used in just your lab or home network for identifying vulnerabilities in your systems.
We are going to be installing the latest version of Nessus v6 Home – as of this post. For the operating system, we will choose Ubuntu 11.10, 12.04, 12.10, 13.04, 13.10, and 14.04 AMD64 and download the .deb package.
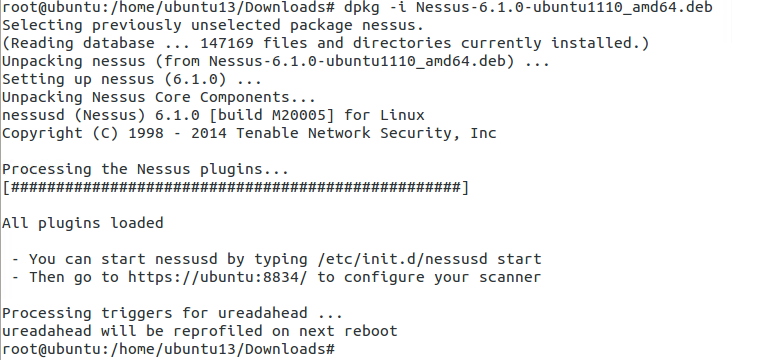
Here are the sequence of commands after you have downloaded the package and opened the appropriate download directory in the terminal.
We are pretty much done. The only thing you need to check is if the Nessus service is running. Usually, it starts automatically but you can verify by running: service nessusd status. If the output shows stopped then simply run the following to start it: service nessusd start.
After above, open your browser and type your IP and port 8834. You can find your IP address by running ifconfig in your terminal. My IP address on this machine is 192.168.244.178.
You should get a similar page as above. Follow through the prompt and in a couple of screens you will have the option to create an initial account for your Nessus scanner. After that, you will need to provide Plugin Feed Registration. For home use, you can request the activation code by completing the following: http://www.tenable.com/products/nessus-home
After completing all the steps thus far – you are done with installing your Nessus scanner. Now you need to configure your scans. Following are the basic steps to configure a scan:
New Scan > Basic Network Scan > [Complete General Page with the Name of the Scan and the target IPs]. On the left side, you have additional scan options that you can play around with. After you are done with making your selections, simply hit save and your scan will automatically start. The scan duration depends on the number of IPs that you are scanning and if they are credentialed or non-credentialed.
After your scan completes you will be able to see the scan results and drill down on each host to see the details on the findings. Later you can also run just reports against previously completed scans.
This is pretty much all you need to do for the basic setup. Feel free to run more scans and try to run a credentialed scan as they will provide the most comprehensive vulnerability information and its also least intrusive on your target systems.